


0
Currency & Commodity Analysis:
US Dollar Index
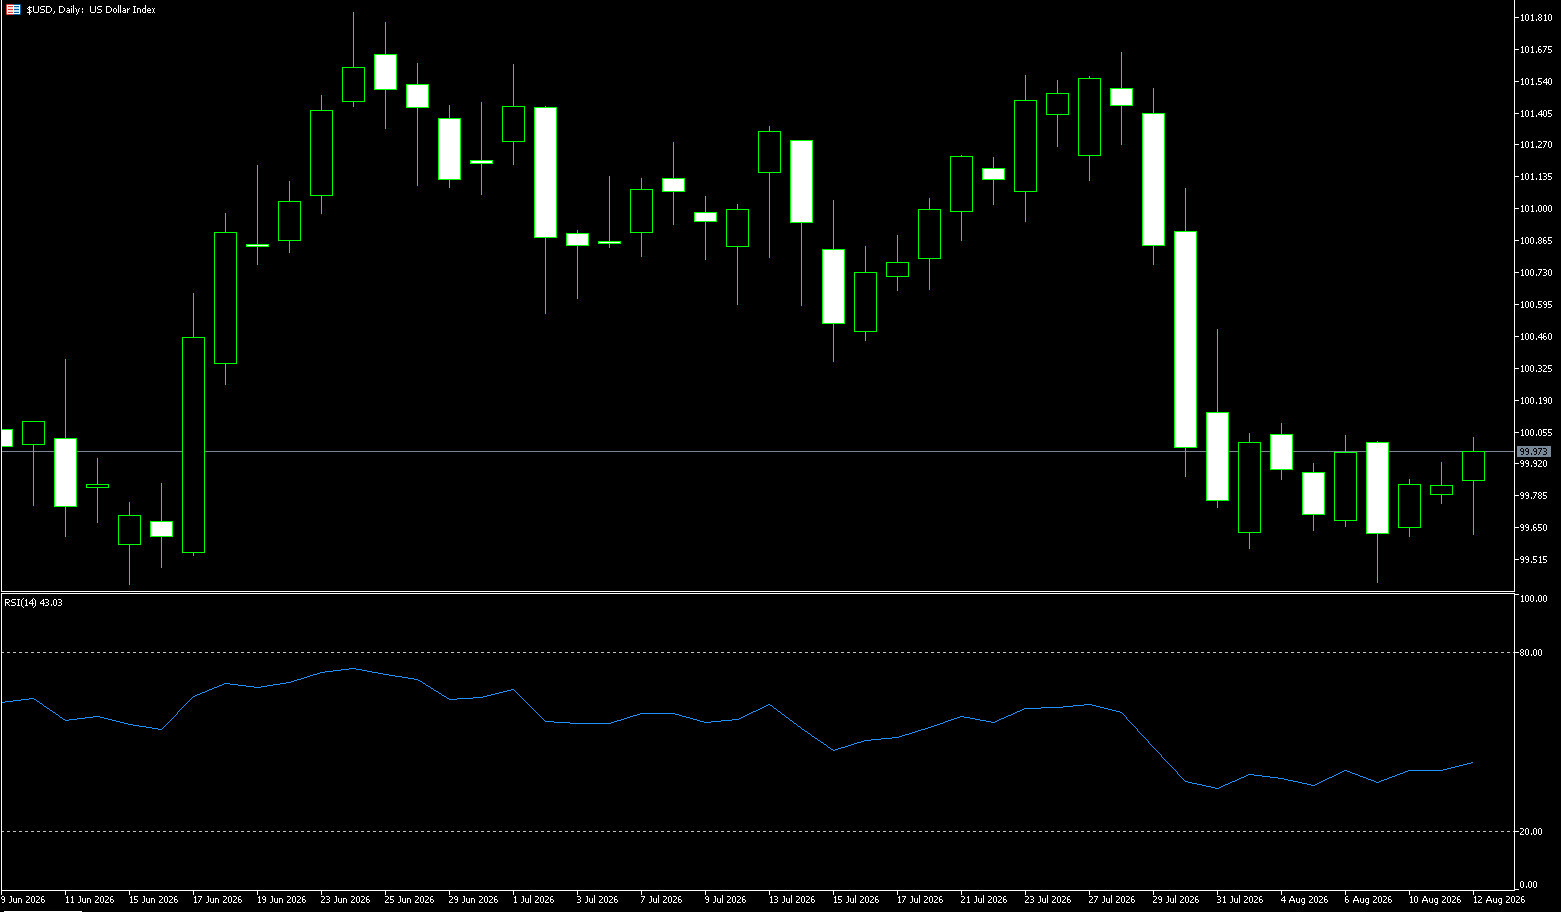
The US dollar index rose slightly on Wednesday, approaching 99.95, as investors prepared for the upcoming key inflation data, which could influence the Federal Reserve's next policy move. Thursday's data includes producer inflation. Market opinions are divided on whether the Fed will raise rates by 25 basis points in September after keeping rates unchanged in July, with rising oil prices further reinforcing a hawkish bias. On Tuesday, Chicago Federal Reserve Bank President Austan Goolsby also stated that central banks are more concerned about inflation remaining too high than about potential weakness in the labor market. Geopolitically, investors assessed the prospect of a US-Iran agreement to reopen the Strait of Hormuz, following Pakistan's defense minister's statement that Washington and Tehran were "close to some kind of arrangement."
On Wednesday, August 12th, the US dollar index traded around 99.80-90, with limited intraday volatility. The current market's unique characteristic is not merely the dollar index's pullback to near the 100 level, but rather the changing monetary policy pricing mechanism. Structurally, the dollar index has recently fallen rapidly from around 101.63 and is currently trading around 99.80-90. The chart shows the Bollinger Bands: middle band around 100.49, upper band around 101.87, and lower band around 99.2712. The index has moved below the middle band and is approaching the lower band area. The MACD's DIFF is around -0.28, DEA is around -0.18, and the histogram remains below the zero line. It's worth noting that the price movement from around 101.63 to around 99.80 occurred during a period of market reassessment of the Fed's policy communication methods, thus its implications extend beyond short-term exchange rate fluctuations. A decisive break above the resistance area around 100.20 could lead to a further test of the 100.49 (20-day moving average) area. Key support below is around 99.41 (early week low); a break below this area could lead to a pullback to around 99.17 (20-day moving average) to find new support.
Today, consider shorting the US Dollar Index at 100.10, with a stop-loss at 100.20 and targets of 99.70 and 99.60.
WTI Crude Oil
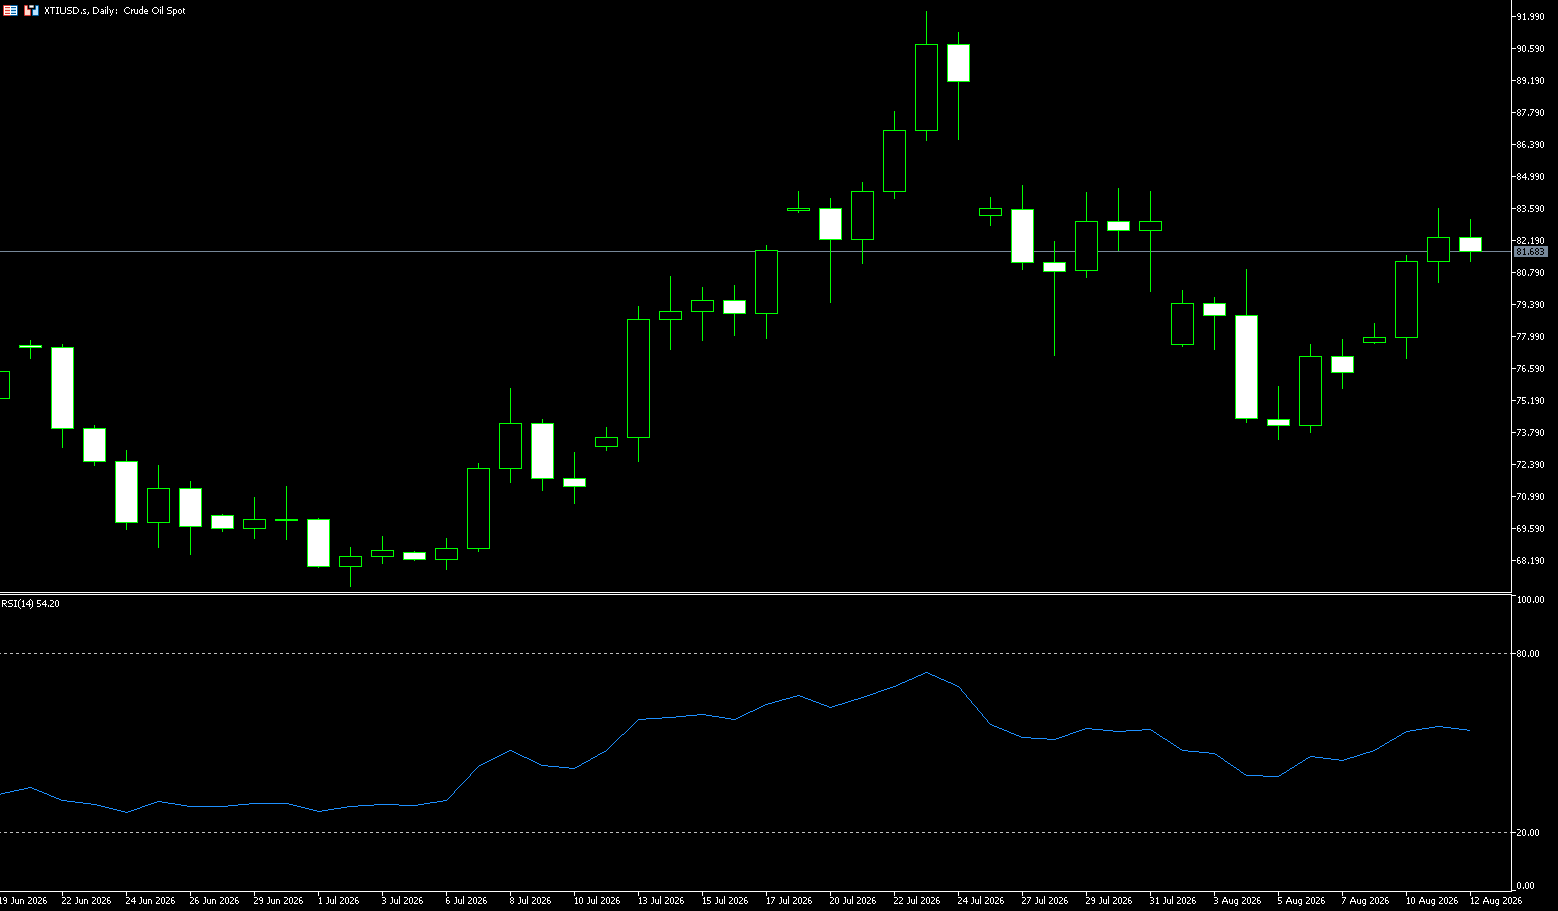
US crude oil prices rose to a one-week high after Iran stated firmly that the Strait of Hormuz will remain closed unless the US changes its behavior and accepts its terms for ending the war. On Wednesday, US crude oil was trading around $82.50 per barrel. The global crude oil market has flashed warning signs of renewed inflation: the US-Iran conflict has lasted for six months, severely disrupting shipping in the Strait of Hormuz; US Strategic Petroleum Reserve (SPR) inventories have fallen to multi-decade lows; and international crude oil prices are approaching key technical levels. Currently, other markets lack short-term positive factors to offset these risks, and the combination of multiple risks suggests that gasoline prices may rise, US Treasury yields may increase, and stock market volatility may intensify in the coming weeks. Both the US and Iran have raised reparations demands, with Iran insisting that the shipping agreement brokered by Oman must include a clause requiring complete US concessions, which is politically unacceptable to Trump, who is preparing for the election. Multiple monitoring data show that Iranian crude oil shipments were almost zero in early August, while floating storage crude oil inventories continued to rise.
Looking at recent trends, WTI crude oil has formed a continuous upward trend, with market focus concentrated on supply-side uncertainties. However, whether the price increase will continue depends on the speed of supply recovery, changes in inventory levels, and the performance of global economic demand. Commodity prices are usually influenced by multiple factors, and the impact of a single event on long-term trends needs to be observed in conjunction with subsequent data. After a period of adjustment, WTI crude oil prices have rebounded continuously on the daily chart, approaching the upper half of the Bollinger Bands. The Bollinger Bands indicator shows the middle band around 81.59, the upper band around 90.17, and the lower band around 73.00, indicating a significantly higher trading range compared to before. Regarding the MACD indicator, after the previous sustained release of bearish momentum, the indicator shows signs of convergence, suggesting some improvement in short-term market momentum. However, technical indicators primarily reflect historical price behavior and cannot solely determine future market direction. Upward resistance levels to watch are $85.11 (July 31 high) and $86.00 (psychological level). Downward support levels to watch are $80.00 (psychological level) and $79.07 (9-day moving average area).
Today, consider going long on crude oil at 81.50, with a stop-loss at 81.35 and targets at 83.00 and 84.00.
Spot Gold
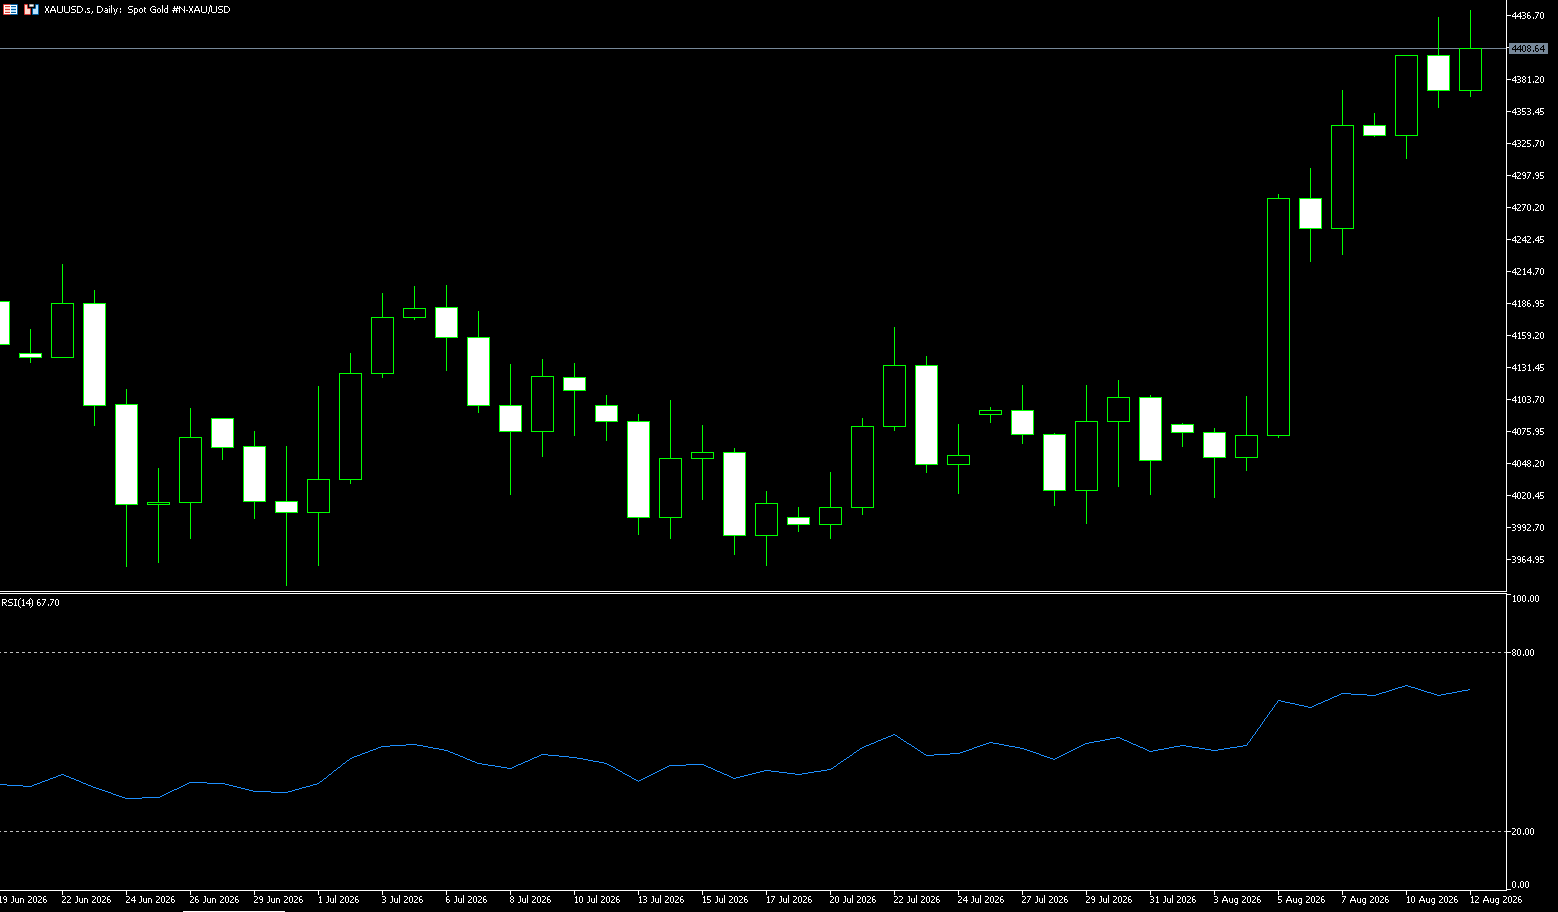
On Wednesday, gold prices rose above $4,420 per ounce, nearing a 10-week high, as investors weighed US inflation data, Federal Reserve policy expectations, and developments in the Strait of Hormuz. US consumer prices rose sharply in July, in line with expectations, easing concerns about an imminent Fed rate hike. Following last week's weak jobs report, moderate inflation prompted investors to lower their expectations for a September rate hike, supporting gold demand. Geopolitical uncertainty remains a key driver, with Pakistan's defense minister stating that the US and Iran are "close to some arrangement" to reopen the Strait of Hormuz, while President Trump claims the US has "complete control" of the waterway. Meanwhile, central bank purchases continue to support gold demand. The People's Bank of China added approximately 20 tons of reserves in July, marking its 21st consecutive month of gold purchases. Global central banks purchased an estimated 289 tons of gold in the second quarter.
The gold market is currently in a window of intense macroeconomic and geopolitical maneuvering. On one hand, last week's unexpectedly weak non-farm payroll data significantly reduced expectations of a September rate hike, providing clear interest rate-related support for gold. On the other hand, the ongoing tensions in the Middle East, particularly the uncertainties surrounding the Strait of Hormuz, continue to influence gold prices through both oil prices and safe-haven demand. From a technical perspective, while the closing price near $4,368 broke below the 100-day moving average of $4,389, it is not far from the previous high of $4,435 (Tuesday's high), remaining within a relatively high range over the past two months. If subsequent inflation data falls short of expectations or further reduces the probability of a rate hike, gold prices are expected to retest the $4,435 and $4,500 (psychological levels). Conversely, if inflation stickiness exceeds market expectations, it could trigger a more significant technical correction towards $4,300 (psychological level) and $4,234 (100-day moving average).
Today, consider going long on gold at 4,400, with a stop loss at 4,395; targets: 4,450 and 4,460.
AUD/USD
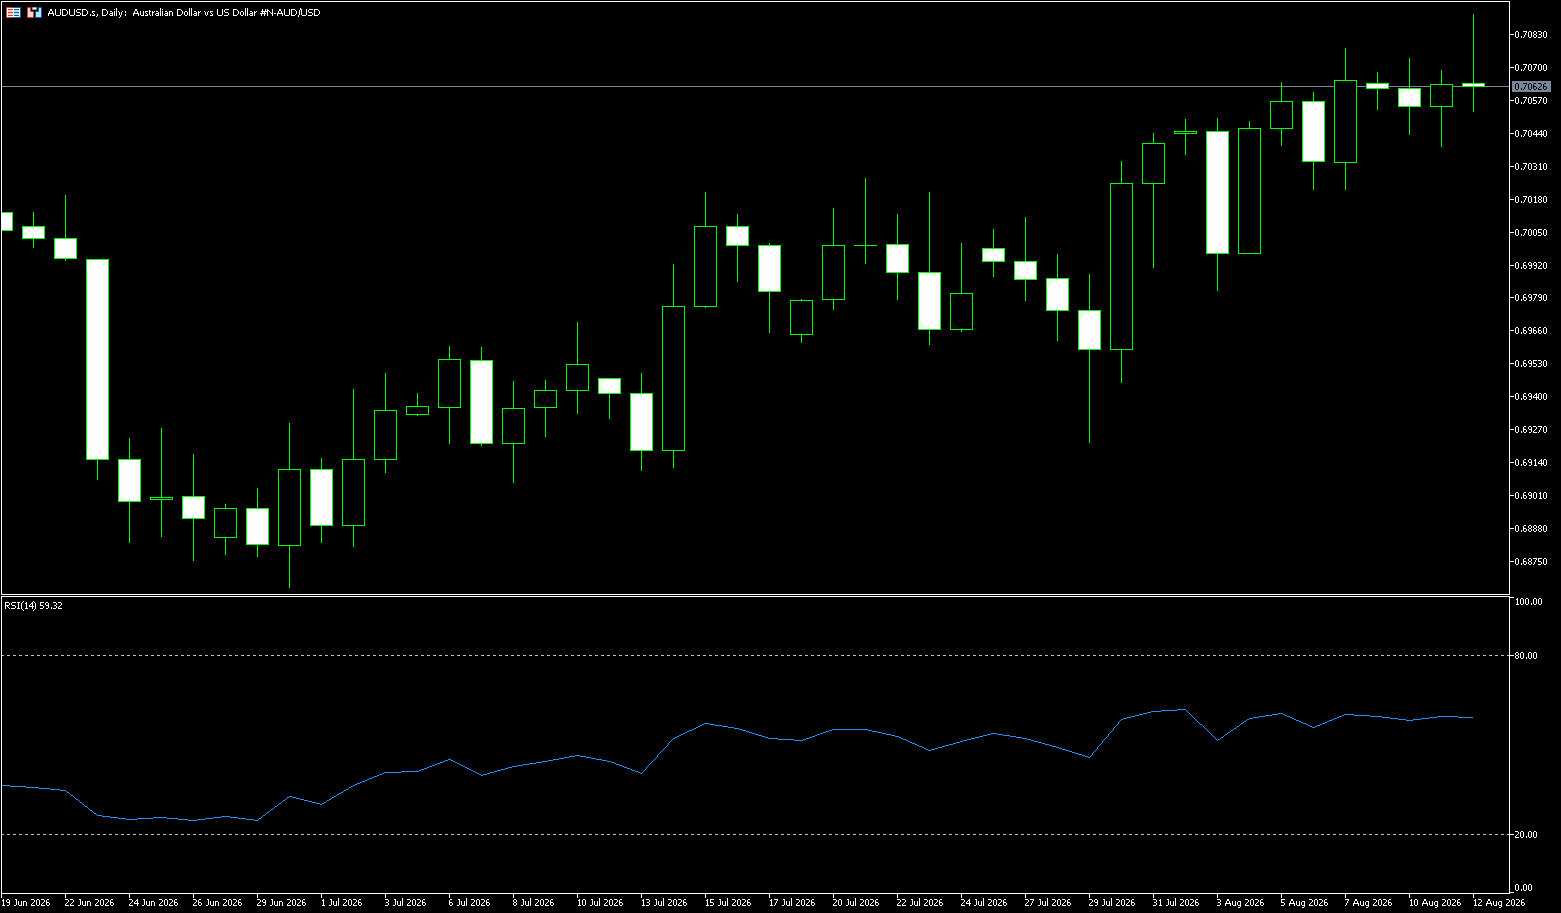
The Reserve Bank of Australia (RBA) kept the interest rate unchanged at 4.35%, as expected, but the next meeting is not until September 29th, while the Fed will act first on September 16th. The RBA predicts inflation will not reach its target until the end of 2027, but the governor's statements were hawkish. With a packed schedule of US data releases over the next seven weeks, the Australian dollar is expected to largely follow the US dollar's movements, with CPI data being key to short-term direction. The US calendar features a plethora of CPI, PPI, and retail sales data releases over the next seven weeks, along with the July meeting minutes on August 19th and the Jackson Hole symposium from August 27th to 29th. Each of these events could potentially repric interest rate expectations, and almost all of them originate from the US. In contrast, Australia has relatively few major data releases during this period – consumer inflation expectations are released on August 13th, the Governor's speech is on the same day, and the monthly CPI data is released on August 26th. None of these releases include policy decisions, meaning that until the last week of September, the Australian dollar will almost entirely follow the US dollar's movements.
On the daily chart, AUD/USD is trading at 0.7060, maintaining a constructive short-term bias, as the current price remains above the 200-day, 100-day, and 55-day simple moving averages, which are clustered between 0.6928 and 0.7053. The currency pair is slightly above the 100-day SMA pivot point at 0.7055, indicating potential demand. The 14-day Relative Strength Index (RSI) of around 59 remains bullish but hasn't yet entered overbought territory, and the low Moving Average Directional Index (MADI) near 11 suggests the trend is still forming and not yet confirmed. On the upside, initial resistance is at 0.7078 (the August 7 high), with broader resistance at the higher psychological level of 0.7100, which could become the next pivot point for trend continuation. Further up, 0.7145, near the June 5 high, may be tested. On the downside, immediate support is reinforced by the 55-day Simple Moving Average (SMA) at 0.7007 and the psychological level of 0.7000, followed by the 200-day SMA at 0.6931.
Consider going long on the Australian dollar at 0.7050 today, with a stop loss at 0.7040 and targets at 0.7100 and 0.7090.
GBP/USD
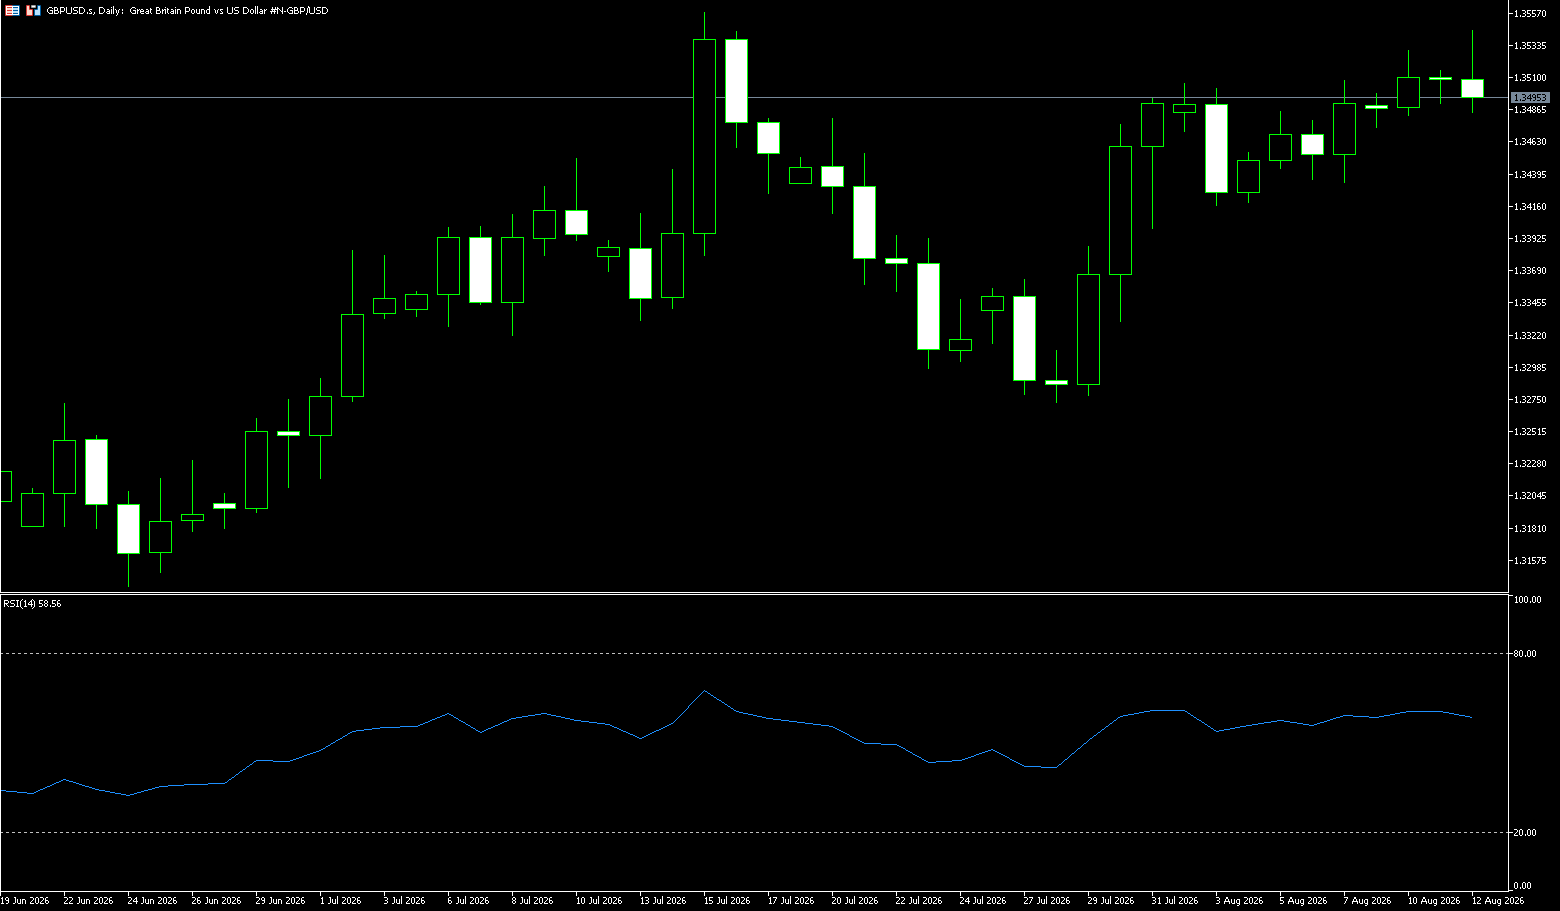
On Wednesday in Asian trading, the pound/dollar pair edged lower after being flat the previous day, trading around 1.3500. The pair held onto its losses as the dollar strengthened ahead of a key inflation report. Investors are closely watching the upcoming data, which is expected to play a significant role in shaping the Federal Reserve's next interest rate decision. Meanwhile, geopolitical uncertainty surrounding a potential diplomatic agreement between the US and Iran provided support for the dollar. Market sentiment improved briefly after Pakistan's defense minister stated that Washington and Tehran were close to reaching an agreement on the Strait of Hormuz, and reports that parallel negotiations between Iran and Oman had entered an advanced stage. However, escalating rhetoric from the White House quickly dampened market optimism. US President Donald Trump adopted a tougher stance, insisting that Tehran must pay compensation to victims of attacks linked to the Islamic Republic, which again injected caution into the market.
From an overall market perspective, the pound/dollar pair is currently driven by two factors: on the one hand, a slowing US economy and a weaker dollar are favorable for the pound; on the other hand, slowing UK economic growth and uncertainty surrounding the Bank of England's policy limit upside potential. Therefore, short-term movements are likely to continue to revolve around macroeconomic data. From a daily chart perspective, GBP/USD maintains a slightly bullish consolidation structure, currently trading around 1.3500 and holding above the 200-day simple moving average at 1.3412. Meanwhile, the previous downtrend resistance line, which was broken, has now become support, currently around 1.3450. Technical indicators show the Relative Strength Index (RSI) hovering around 61, indicating bullish momentum, but it hasn't yet entered clearly overbought territory. Resistance is seen around the recent high of 1.3530; a break above this level could lead to a further test of the 1.3600 area. Support is seen at 1.3450, followed by the 200-day simple moving average at 1.3412, and the 1.3400 moving average level; a break below these levels could increase downward pressure.
Today, consider going long on GBP at 1.3485, with a stop-loss at 1.3474 and targets at 1.3550 and 1.3560.
USD/JPY
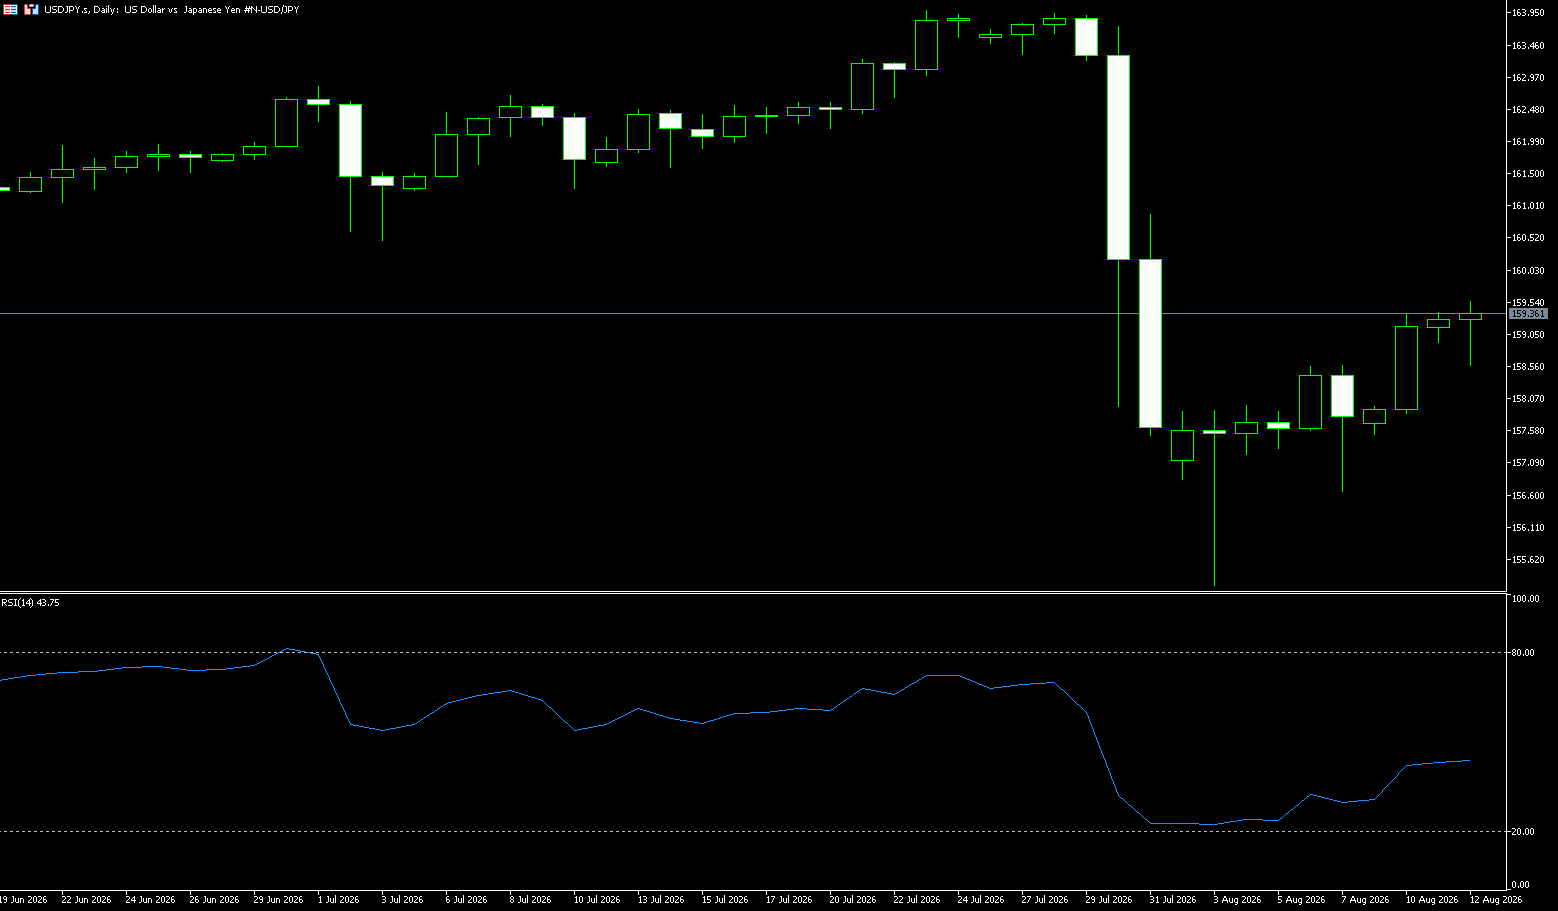
On Wednesday morning in Asian trading, USD/JPY traded around 159.40. A record 8.45 trillion yen intervention initially pushed the exchange rate down from 164 to 155, but seven weeks later, about half of the intervention gains have been given back, and the 160 level is approaching again. Intervention changes prices but not the 275 basis point interest rate differential between USD and JPY. The intervention mode has shifted from "silent" to "open," giving the market the right to test the defense level. If the US CPI exceeds expectations on Wednesday, expectations of a September rate hike will reignite, and the battle for 160 may begin sooner than anticipated. The pre-intervention peak was slightly below 164.00—a level USD/JPY hadn't reached since December 1986. The post-intervention low was near 155.00, with a roughly 9-yen intervention-induced fluctuation, represented by a record 8.45 trillion yen in purchases in a single day and approximately 5.3 trillion yen coordinated with the US Treasury the following day. Seven trading days later, more than 4 yen of that 9 yen has been given back, nearing the 160 level. The success of the intervention hinges on whether price levels can be held, not the amount on the check—by this criterion, the intervention has already failed halfway.
The USD/JPY pair is currently trading around 159.30-40, with the effects of the record intervention rapidly fading, and more than 4 yen of the 9-yen intervention-induced fluctuation already given back. The intervention changed prices, not the reasons for selling—the 275 basis point interest rate differential between USD and Japan remains the core driver. USD/JPY is at 159.25, remaining within the upward channel since the August 3 low of 155.23. Momentum indicators show a mild upward pull, with the Relative Strength Index (RSI) at 44 and the Moving Average Convergence Divergence (MACD) at a slightly positive level, suggesting that the upward momentum in this short-term uptrend is stabilizing. Bulls are watching the psychological level around 160, which limited gains last week. Further gains are expected to test the area around 160.90 near the July 31 high. On the downside, the double-top neckline area near 158.55, followed by the support zone around the 200-day simple moving average at 158.14, provides significant support.
Consider shorting the US dollar at 159.60 today, with a stop loss at 159.80 and targets at 158.50 and 158.60.
EUR/USD
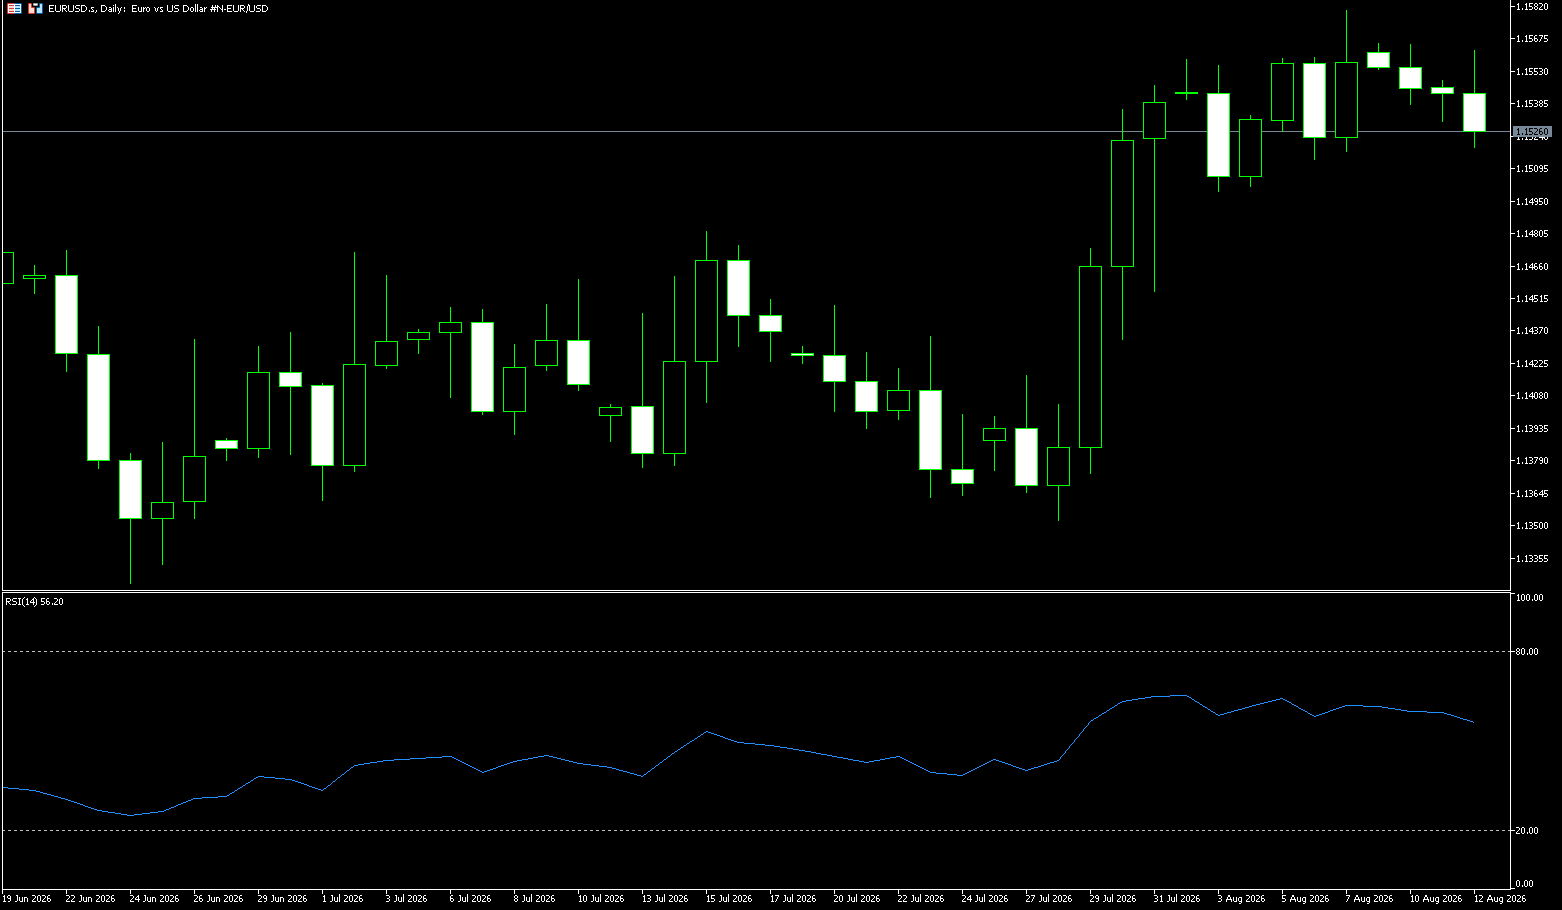
The euro/dollar pair struggled to gain any meaningful traction during Wednesday's Asian session, remaining around 1.1500, still within the familiar range of the past week or so. Traders are closely awaiting the release of key U.S. inflation data and further developments in the Middle East crisis before establishing new directional bets. Meanwhile, oil-driven inflation concerns keep bets on a Federal Reserve rate hike on the table, supporting the dollar and limiting the currency pair's gains. On Tuesday, oil prices surged to a one-and-a-half-week high after Iranian Supreme Leader advisor Mojtaba Khamenei stated that the Strait of Hormuz would not reopen until the U.S. met Tehran's demands. In addition, the Iranian-backed Houthi rebels in Yemen have intensified attacks on ships in the Red Sea and the Bab el-Mandeb Strait, particularly those linked to Saudi Arabia. This has led to a rise in war risk premiums, providing support for oil prices and the safe-haven dollar.
The euro/dollar remains capped below the 100-day simple moving average at 1.1567 and the 50.0% Fibonacci retracement level of the May-June decline at 1.1562. This suggests that as long as these levels limit gains, upward attempts are likely to be suppressed. The 14-day Relative Strength Index (RSI) is near 59, indicating that bullish momentum has not yet been overextended. Once the aforementioned resistance area is broken by the bulls, the pair will test 1.1600 (the psychological level) and 1.1620 (near the monthly high). On the downside, initial support is at the 38.2% Fibonacci retracement level of 1.1506, followed by the 23.6% Fibonacci retracement level of 1.1437, where buyers may attempt to stabilize the spot price.
Consider going long on the Euro at 1.1510 today, with a stop-loss at 1.1500 and targets at 1.1570 and 1.1580.
Stock Analysis:
Australian ASX 200 Stock Index
Basic Market Overview:
The Australian Securities Exchange (ASX) 200 index fell 41 points, or 0.45%, to close at 9,209 on Wednesday, erasing the previous day's modest gains. A sharp decline in manufacturing, consumer goods, healthcare, and retail trade dragged the index to its lowest level in a week. Market sentiment deteriorated after the Reserve Bank of Australia kept the cash rate unchanged at 4.35% on Tuesday but warned of further policy tightening if inflation persists. Overnight declines on Wall Street added pressure, while escalating tensions in the Middle East and renewed attacks near key shipping routes exacerbated concerns about energy supplies.
Commonwealth Bank fell 0.7%, despite reporting a record annual cash gain, but noted a sharp slowdown in mortgage demand following tax changes. Rio Tinto fell 0.2%, despite receiving government support to offset soaring energy costs. The ASX fell 2.8% after a shareholder filed a Federal Court application for action against the exchange operator. Conversely, AGL Energy rose 6.0% due to stronger-than-expected 2027 earnings guidance.
Sector Performance:
Leading Sectors
Leading Sectors (Only Two Sectors to Rise)
1. Utilities +2.64% [Strongest Performer]
Core Driver: AGL Energy (AGL) raised its 2027 earnings guidance, surging 6%; funds flowed into defensive utilities for safety.
2. Information Technology +0.16% Significant internal divergence; large SaaS stocks generally under pressure, while a few small and medium-sized technology stocks bucked the trend and strengthened.
Leading Sectors (Ranked by Decline)
1. Consumer Staples -0.76% Supermarket giants Woolworths and Coles both weakened; weak retail expectations dragged down the sector.
2. Industrials -0.68% Logistics and business services were under pressure; a sharp drop in Computershare dragged down the sector's performance. 3. Financials -0.59% [Heavyweight drags down the core of the market] All four major banks declined; Commonwealth Bank (CBA) closed lower despite strong earnings, but a pessimistic outlook for mortgage demand led to a decline; ASX Ltd. fell sharply by 2.8%.
4. Energy -0.42% Oil and gas leaders Woodside and Santos saw slight declines, with significant divergence among individual stocks within the sector.
Technical Analysis:
The ASX200 closed at 9209.4 on Wednesday, down 41.2 points, or -0.45%. The index opened higher but fluctuated downwards throughout the day, trading between 9183 and 9283, closing at a one-week low; this is the third decline in four trading days, indicating a decrease in market risk appetite. The number of advancing and declining stocks was significantly divergent, with the number of declining stocks nearly doubling, indicating weak profit-making opportunities. Daily chart: A surge followed by a pullback resulted in a bearish close, with the price oscillating below 9300 under pressure. The RSI has retreated from its high, indicating weakening bullish momentum and a consolidation phase within a high-level range.
4-hour chart: A series of lower highs have formed, suggesting a slightly bearish bias in the short term. Currently, there has been no significant breakout, indicating a high-level consolidation and adjustment, not a deep correction. Overall pattern: Range-bound trading; direction awaits confirmation through a breakout. Avoid premature one-sided bets. Two possible scenarios for Sunday's price action: Optimistic scenario—Holding above 9180 support and stabilizing at 9240, a move towards 9280; a decisive break above 9300 opens up further upside potential. Pessimistic scenario—A break below 9180 that fails to recover within the day suggests a further decline to 9140; if 9140 is breached, the correction could extend to around 9100.
Trading Strategy:
Thursday Trading Strategy (Short-Term Approach)
Bull Strategy (Cautious Buying on Dips, Avoid Chasing Highs)
• Opportunity: Consider a small long position if the price retraces and stabilizes within the 9185-9195 range.
• First Target: 9240; Second Target: 9280
• Stop-Loss: Exit if the price breaks below 9175.
Bear Strategy (Enter Only After Breakout Confirmation)
• Opportunity: If the price continues to be under pressure and breaks below 9180, consider shorting.
• First Target: 9140; Second Target: 9100
• Stop-Loss: Exit if the price rebounds back above 9210.
Key Risk Warnings:
External Risk Contagion: Higher-than-expected US inflation data tonight will suppress global stock markets and further weaken the ASX200 rebound momentum; also, pay attention to overnight fluctuations in US stock futures.
Commodity Linkage Risk: Fluctuations in iron ore and copper prices directly affect resource weightings; unusual Australian dollar exchange rate movements can disrupt foreign capital flows. RBA Expectations Continue to Disrupt Market Sentiment: Market speculation regarding the timing of an Australian interest rate cut continues, with bond yield volatility persisting and weighing on the banking and real estate REITs sectors.
Liquidity Risk: With Australian stocks entering earnings season, disappointing individual earnings could drag down the index across sectors, further exacerbating market divergence.
Hong Kong Hang Seng Index
Basic Market Overview:
The Hang Seng Index fell 1.0%, or 259 points, to 25,390 on Wednesday, as waning hopes for a US-Iran deal and cautious sentiment regarding the latest US inflation data weighed on investor sentiment. Oil prices climbed to a one-week high due to tensions around the Strait of Hormuz, fueling concerns about inflation and global growth. The decline also followed losses on Wall Street. In the region, Hong Kong tech stocks remained under pressure, with investors closely watching Tencent's second-quarter earnings for signs of growth in gaming, advertising, and artificial intelligence investments. Meanwhile, plans to expand the Hang Seng Tech Index from 30 to 50 constituent stocks could increase exposure to emerging sectors such as artificial intelligence and robotics. Hong Kong's IPO market is also attracting attention, with reports that Shein is preparing to launch its IPO in Hong Kong, supporting optimism about the city's capital market activity. Notable laggards include Tencent (-2.3%), AIA (-0.6%), Lenovo (-0.6%), Kuaishou (-1.6%), and Meituan (-2.3%).
Sector Performance:
Leading Sectors (Defying the Trend)
1. Optical Communication / Optical Modules, AI Hardware, Semiconductor Chips: Zhongji Xuchuang, MINIMAX-W, Montage Technology, Huahong Grace, and SMIC strengthened; AI computing hardware continued to receive investor favor.
2. Mainland Property Stocks (Real Estate Development): Longfor Group, China Resources Land, China Jinmao, Sunac China, and Country Garden rose, supported by expectations of policy stabilization for the real estate market.
3. Gold / Non-ferrous Metals: Precious metals such as Chifeng Gold strengthened, driven by safe-haven demand.
4. Consumer Staples (Food & Beverage): Defensive stocks like Tingyi (Cayman Islands) Holding showed slight resilience.
Leading Sectors (Drag Down the Market):
1. Internet Platforms, Online Entertainment, Gaming & Technology (Biggest Drag): Tencent Music - SW plunged over 12%, NetEase -5.08%, Bilibili - W, Alibaba, JD.com, and Kuaishou all retreated; Tencent Holdings weakened slightly (earnings announced after market close).
2. Software SaaS, Enterprise Services: Kingdee International and others fell sharply.
3. Oil & Energy, Cyclical Resources: Oil and gas stocks were under pressure throughout the day.
4. Innovative Drugs/Pharmaceuticals: Strong yesterday, but saw a significant pullback today, with Hansoh Pharmaceutical among the biggest losers.
Technical Analysis:
The Hang Seng Index closed at 25440.17, down 0.83% (-212.65 points); total market turnover was HK$216.779 billion; Hang Seng Tech Index closed at 4776.44, down 0.99%; net outflow of southbound funds was HK$2.906 billion. The index opened higher but closed lower throughout the day, with an intraday high of 25498 and a low of 25323, trending downwards throughout the day. There was no significant buying interest at the close. Following Tuesday's breach of the 26000 level, the index closed lower for the second consecutive trading day, indicating a rapid weakening of the bullish rebound. With two consecutive negative daily candles, the index has officially entered a high-level consolidation and correction phase. The previous psychological level of 26000 has transformed from support into strong resistance; the bulls' short-term advantage has disappeared, and the market has shifted to range-bound trading with intensified competition between bulls and bears. Southbound capital saw net selling for two consecutive days, reflecting increased short-term profit-taking by domestic investors. Overnight, weak US stocks and high US Treasury yields suppressed valuations of offshore growth stocks.
The daily MACD histogram continues to converge, posing a risk of a death cross. Short-term moving averages are turning downwards. Bullish momentum has weakened significantly, with bears in control in the short term. It is not advisable to blindly buy the dip before a clear bottoming signal appears. Three possible scenarios for Thursday's market movement:
1) Baseline Scenario (High Probability): Weak Range-Bound Fluctuation
The market is likely to open under pressure, testing the 25320 support level. If this support holds, the intraday rebound will be limited, making it difficult to hold above 25650, and the market will likely remain within the 25320-25650 range throughout the day.
2) Pessimistic Scenario: Effective Break Below 25320
A significant break below 25320 with high volume, and failure to recover within half an hour, would lead to further declines towards the 25150-25200 support zone, opening up further downside potential.
3) Optimistic Scenario (Low Probability): A significant overnight rebound in overseas markets, with the index strongly recovering 25650, will lead to a retest of the 25800 resistance level, reversing the short-term weakness.
Trading Strategy:
Bearish Outlook (Main Strategy):
If the index rebounds to 25600-25650 and fails to break through, a small short position can be attempted; the stop-loss should be placed above 25800; the first target is 25320, and the second target is 25180.
Long Outlook (Buy on Dips Only, Avoid Chasing Rallies):
If a stabilization signal appears near 25320, a small long position can be attempted; a strict stop-loss should be set below 25280; the rebound target is 25580-25650.
Important: If the index breaks below 25320 decisively, abandon long positions and do not try to predict the bottom.
Key Risk Warnings:
External Liquidity Risk: Continued volatility in US Treasury yields and the US dollar index continues to suppress Hong Kong growth stocks; overnight overseas stock market movements will directly impact the opening gap risk of Hong Kong stocks the following day, with extremely high overnight uncertainty.
Interim Earnings Risk: Currently, Hong Kong stocks are in the midst of a concentrated period of interim earnings reports. Lower-than-expected earnings in the internet and consumer sectors could easily trigger a concentrated sell-off in individual stocks, dragging down the index.
Capital Flow Risk: Continued outflows of southbound funds and declining risk appetite among foreign investors mean that the rebound will be very unsustainable without incremental funds.
Disclaimer: The information contained herein (1) is proprietary to BCR and/or its content providers; (2) may not be copied or distributed; (3) is not warranted to be accurate, complete or timely; and, (4) does not constitute advice or a recommendation by BCR or its content providers in respect of the investment in financial instruments. Neither BCR or its content providers are responsible for any damages or losses arising from any use of this information. Past performance is no guarantee of future results.
More Coverage





Risk Disclosure:Derivatives are traded over-the-counter on margin, which means they carry a high level of risk and there is a possibility you could lose all of your investment. These products are not suitable for all investors. Please ensure you fully understand the risks and carefully consider your financial situation and trading experience before trading. Seek independent financial advice if necessary before opening an account with BCR.
BCR Co Pty Ltd (Company No. 1975046) is a company incorporated under the laws of the British Virgin Islands, with its registered office at Trident Chambers, Wickham’s Cay 1, Road Town, Tortola, British Virgin Islands, and is licensed and regulated by the British Virgin Islands Financial Services Commission under License No. SIBA/L/19/1122.
Open Bridge Limited (Company No. 16701394) is a company incorporated under the Companies Act 2006 and registered in England and Wales, with its registered address at Kemp House, 160 City Road, London, England, EC1V 2NX. Open Bridge Limited acts solely as a payment processor for BCR Co Pty Ltd and does not provide any financial, trading, or investment services on its behalf. Open Bridge Limited's role is limited to payment processing.


 English
 简体中文
简体中文
 繁體中文
繁體中文
 Bahasa
Melayu
Bahasa
Melayu
 Tiếng
Việt
Tiếng
Việt
 ไทย
ไทย
 日本語
日本語
 한국어
한국어
 ភាសាខ្មែរ
 español