


0
Currency & Commodity Analysis:
US Dollar Index
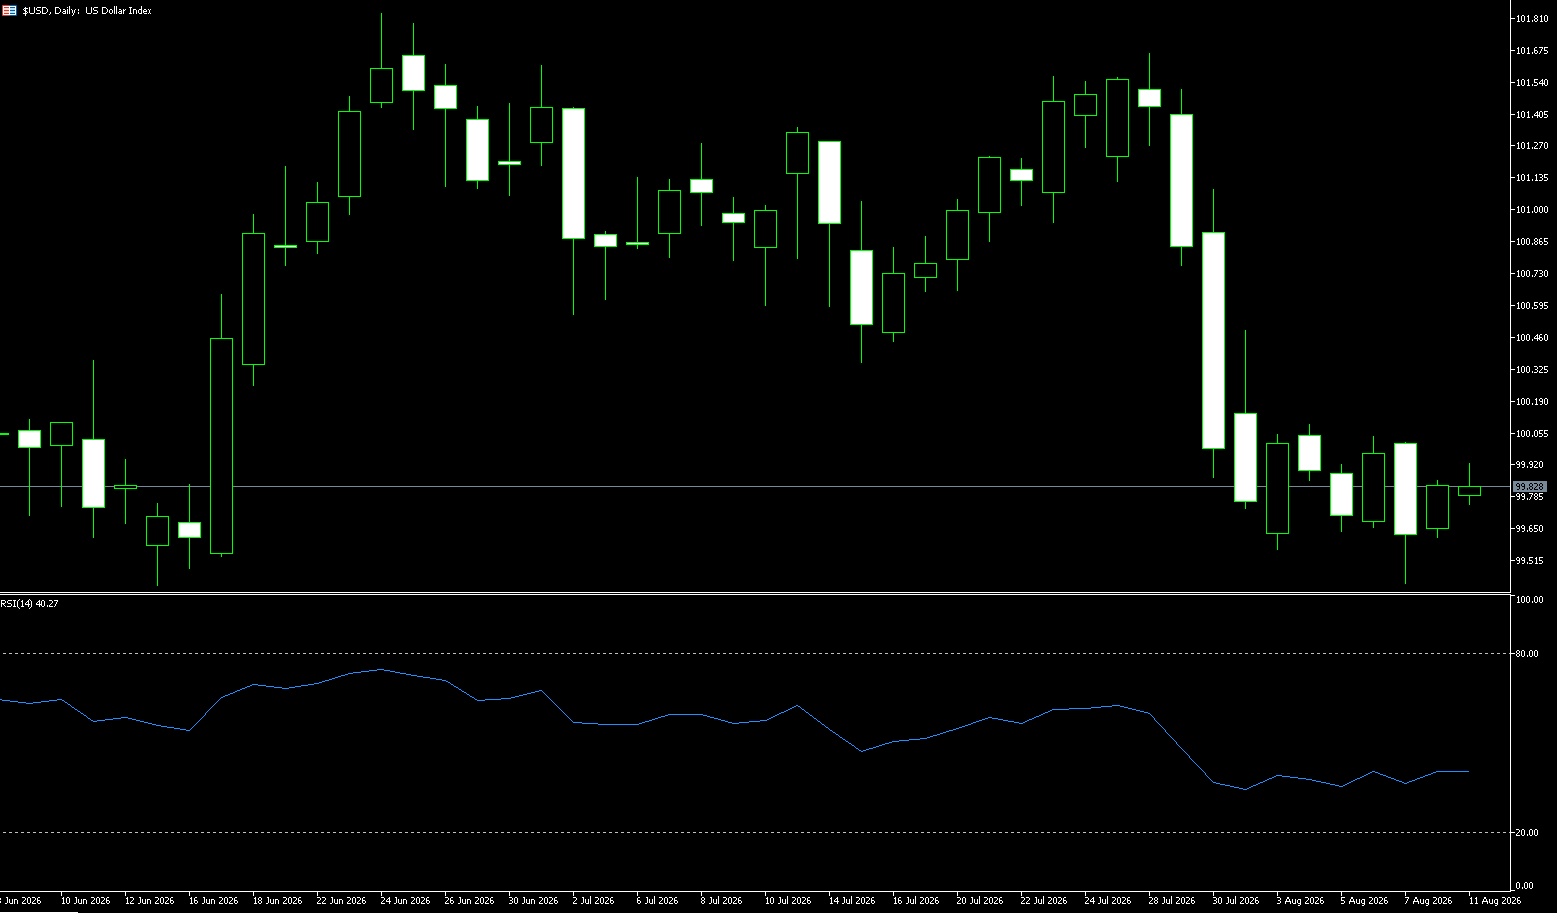
The US dollar index remained stable around 99.75 on Tuesday, maintaining the gains of the previous trading day, as investors continued to assess the outlook for the Federal Reserve's monetary policy, especially ahead of key US inflation data following the weak July jobs report. The highly anticipated Consumer Price Index report is scheduled for release on Wednesday, followed by producer inflation data on Thursday. The market currently estimates a 51% probability of a 25 basis point rate hike by the Federal Reserve in September, up from 44% the previous day. Cleveland Federal Reserve President Beth Hammark stated that several rate hikes may be needed to bring inflation back to the central bank's 2% target. Meanwhile, uncertainty surrounding a potential agreement between the US and Iran to end the war and reopen the Strait of Hormuz continues, keeping the market cautious about the inflation and interest rate outlook.
From a daily chart perspective, the US dollar index has recently formed a consolidation pattern between 98.50 and 100. Currently, the price is approaching the 100 level again, indicating that bulls are attempting to regain control. The daily moving average structure has improved, and market momentum is gradually strengthening. If the dollar index can effectively break through the resistance area near 100.20, it may further test the 101.00 to 101.50 area. The key support level to watch is around 99.00; a break below this area could lead to a pullback to around 98.50 to find new support. The overall trend is currently biased towards a slightly bullish consolidation, but further confirmation from macroeconomic data is needed.
Today, consider shorting the US Dollar Index at 99.92, with a stop-loss at 100.00 and targets at 99.50 and 99.40.
WTI Crude Oil
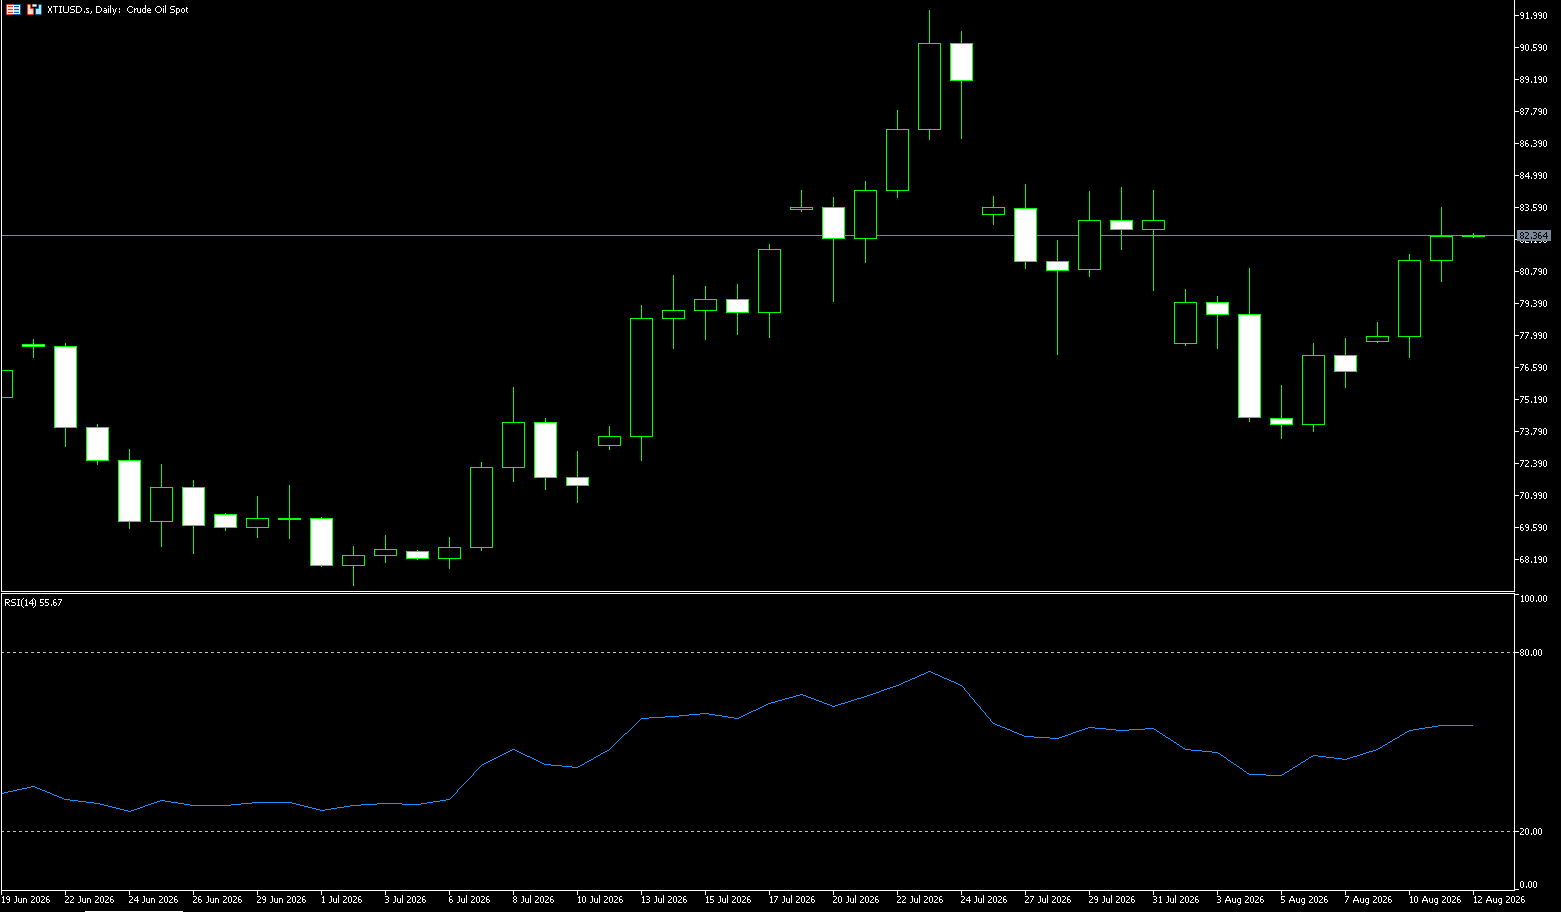
WTI crude oil is trading around $82.00 per ounce. Oil prices surged nearly 7% on Monday as the US and Iran's mutual demands regarding compensation dimmed the prospects for a deal to reopen the Strait of Hormuz. Overall, the core contradiction in the current international oil market still revolves around reopening the US-Iran geopolitical standoff and the resulting navigational dispute over the Strait of Hormuz. The market is concerned about a potential second wave of supply shocks. Simultaneously, the simultaneous decline in global supply and demand amid the US-Iran conflict has lowered the ceiling for oil price increases. However, recent key marginal variables have begun to revolve around the leadership's intentions and the political maneuvering within the US and Iran. For example, Iranian hardliners are unwilling to relinquish their core interest in controlling the Strait and may choose more hawkish officials to take office, while the US needs to maintain its image of controlling the US-Iran conflict before the midterm elections.
Observing the daily chart of WTI crude oil, prices previously experienced a rapid rise, followed by a continuous decline after reaching a temporary high. Currently, prices have returned to near the Bollinger Middle Band, and the Bollinger Bands are generally converging, indicating a decrease in market volatility compared to previous highs. Technically, the MACD indicator, after a pullback from its highs, is currently in a weak consolidation phase, with short-term momentum weakening. Meanwhile, the rebound in oil prices from their lows suggests that the market has not completely turned pessimistic but is seeking balance within a new information framework. Ultimately, the overall US economic blockade against Iran and its active efforts to advance negotiations, coupled with the pressure of the midterm elections, have significantly compressed the recent upside potential for oil prices. WTI oil prices have shown strong overall rebound strength. Although they encountered resistance at $85.11 (July 31 high) and $86.00 (psychological level), further rebounds are still highly probable. Current support levels are around $80.00 (psychological level) and $79.09 (9-day moving average). If these levels hold, oil prices have the potential for further rebound.
Today, consider going long on crude oil at 82.08, with a stop loss at 81.85 and targets of 84.00 and 85.00.
Spot Gold
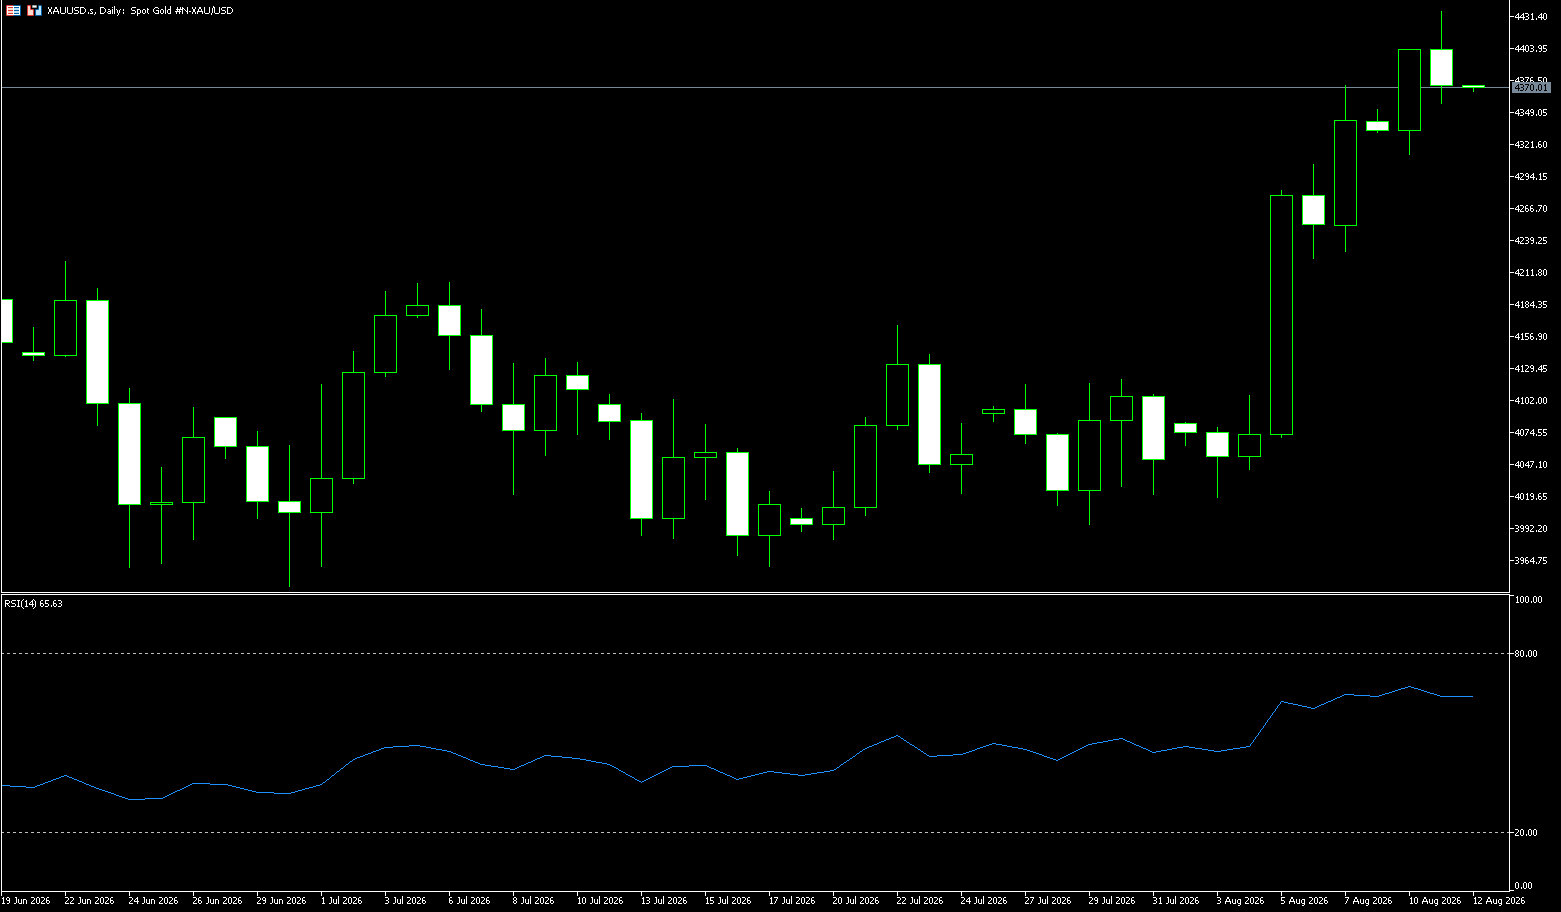
On Tuesday (August 11th, Beijing time) in early Asian trading, spot gold briefly touched $4400/oz. Gold prices were driven by technical buying, increased central bank gold purchases, and cautious sentiment among investors ahead of key inflation data releases. Currently, gold's overall technical momentum is strong, and there is a fear of missing out on a return to the $4500 level. The People's Bank of China's July gold reserve increase was the largest since October 2023, further supporting buying. This week, the market is focused on the US CPI data on Wednesday and PPI data on Thursday to assess the Fed's policy path. Currently, the CME FedWatch tool shows traders expect a 50% probability of a rate hike in September and an 81% probability in December. Geopolitically, Iran stated that it is close to reaching an agreement with Oman on a new navigation channel in the Strait of Hormuz, but reiterated that the US must meet other conditions before reopening the waterway.
From a technical perspective, the daily chart shows that gold prices had been trading near and below the Bollinger Band's midline at 4,123 for an extended period. However, in recent trading days, prices have rapidly broken out of this consolidation range and are now trading above the midline. The recent high near the psychological level of 4,400 indicates that the market has shifted from a low-volatility consolidation to a higher-volatility state. The sudden breakout from the prolonged narrow trading range, with the price rapidly widening the distance between itself and the midline, suggests that the market is undergoing a volatility repricing. On the upside, the 4,495-4,510 USD range (the 200-day simple moving average and the 38.2% Fibonacci retracement of the March-August downtrend) forms the next significant resistance level. On the downside, immediate support lies at 4,300 USD (the 23.6% Fibonacci retracement), followed by 4,250 USD (the 65-day simple moving average) and then 4,200 USD (the psychological level).
Today, consider going long on gold at 4,365, with a stop loss at 4,360; targets: 4,410 and 4,420.
AUD/USD
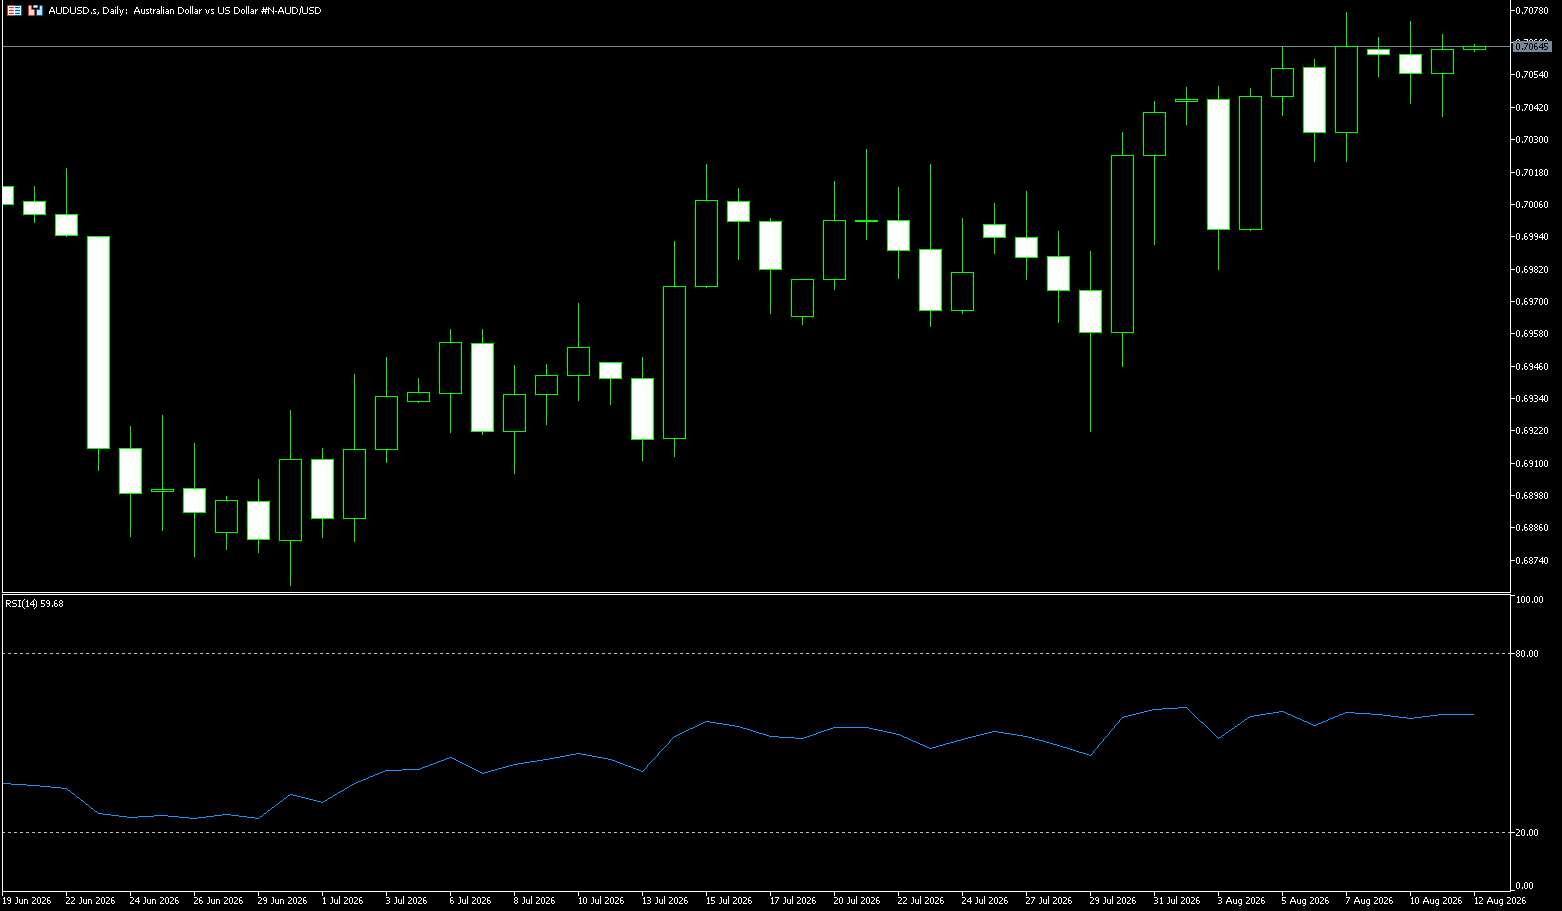
The Australian dollar remains above US$0.7055, near an eight-week high, as investors await the Reserve Bank of Australia's (RBA) monetary policy decision on Tuesday. The market widely expects the central bank to keep the cash rate unchanged at 4.35% for the second consecutive meeting, although policymakers are expected to maintain a hawkish stance due to persistently high inflation. The market estimates a roughly 50% probability of another 25 basis point rate hike by the end of the year, and traders will be closely watching the RBA's latest forecasts and Governor Michelle Bullock's comments for clues about the future policy path. Elsewhere, the US dollar weakened against major currencies as a surprise drop in US jobs in July reduced market expectations for a Fed rate hike. The Australian dollar is also poised to rebound to a 35-year high against the Japanese yen as the impact of Tokyo's currency intervention diminishes and the RBA's hawkish stance strengthens the exchange rate.
The Reserve Bank of Australia (RBA) is expected to keep the Official Cash Rate (OCR) unchanged at 4.35% for the second consecutive meeting on Tuesday. The Australian dollar/US dollar pair is trading steadily above short- and medium-term moving averages. A bullish crossover of the 21-day and 50-day simple moving averages supports the rally, while the 200-day simple moving average at 0.6928 reinforces the broader bullish structure. The 14-day Relative Strength Index (RSI) is near 60, biased upwards but not yet in overbought territory, suggesting that upward momentum on the daily chart remains constructive. On the upside, initial resistance lies at the psychological level of 0.7100, which could become the next pivot point for a trend continuation. Further up, the 0.7145 level near the June 5 high could be tested. On the downside, initial support lies near 0.7000, the confluence of the 21-day and 50-day simple moving averages. A break below this level could see the 200-day simple moving average at 0.6928 become a deeper defense.
Consider going long on the Australian dollar at 0.7045 today, with a stop loss at 0.7033 and targets at 0.7100 and 0.7090.
GBP/USD
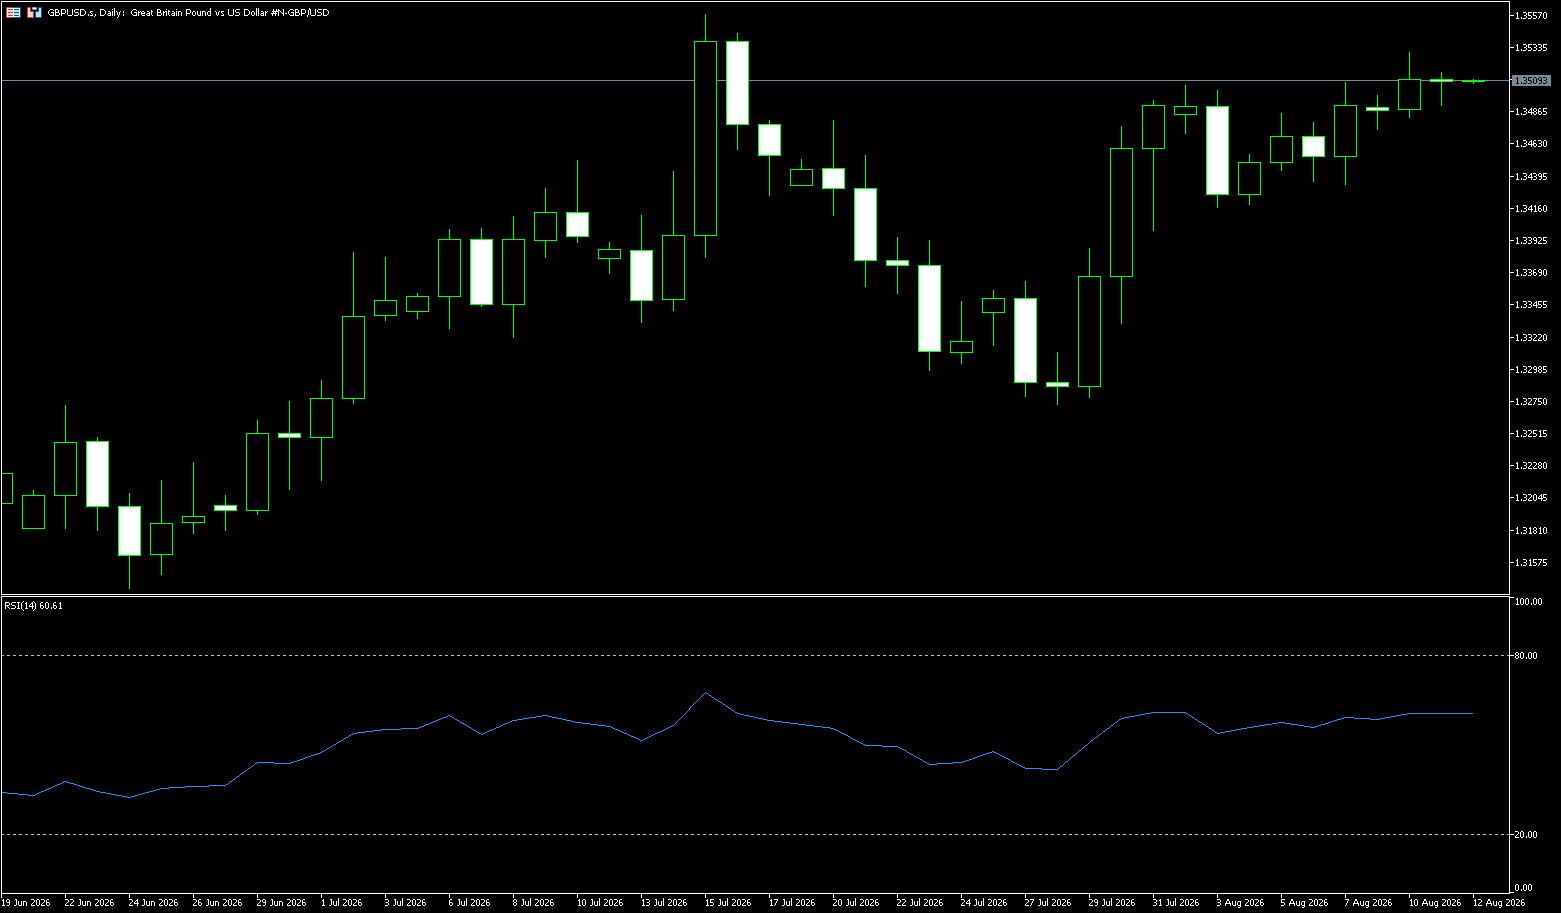
During Tuesday's Asian trading session, the pound held onto its two-day gains slightly near 1.3500 against the dollar. Despite financial markets no longer pricing in the possibility of a near-term interest rate hike by the Bank of England, the pound has outperformed the dollar, keeping GBP/USD firm. The main catalyst for the pound this week will be the UK's preliminary second-quarter GDP and June GDP data released on Thursday. The UK economy is expected to grow at a modest pace of 0.4% from April to June, lower than the previous 0.6%. On a monthly basis, GDP is expected to contract by 0.1%. Meanwhile, the dollar index was almost flat at the time of writing, holding near 99.80 after rebounding on Monday. The dollar index is expected to remain range-bound as investors await the US July Consumer Price Index (CPI) data to be released on Wednesday.
On the daily chart, GBP/USD is trading around 1.3500, maintaining a short-term bullish tone as the spot price holds above the 10-day simple moving average at 1.3463, while the broken downtrend resistance line is currently providing support around 1.3456. The 14-day Relative Strength Index (RSI) is at 60.75, leaning towards positive territory, indicating that buyers remain dominant, and momentum has not yet extended to overbought territory. On the downside, near-term support first appears around the 10-day simple moving average at 1.3463, where the previous trendline resistance has turned into support, followed by the 200-day simple moving average at 1.3409. A deeper pullback from this level is expected to attract new buying. As long as GBP/USD holds these underlying support levels, the pair is likely to continue its upward bias, potentially breaking above this week's high of 1.3530, with the next target at 1.3558 (the July 15 high).
Today, consider going long on GBP at 1.3495, with a stop loss at 1.3483 and targets at 1.3550 and 1.3560.
USD/JPY
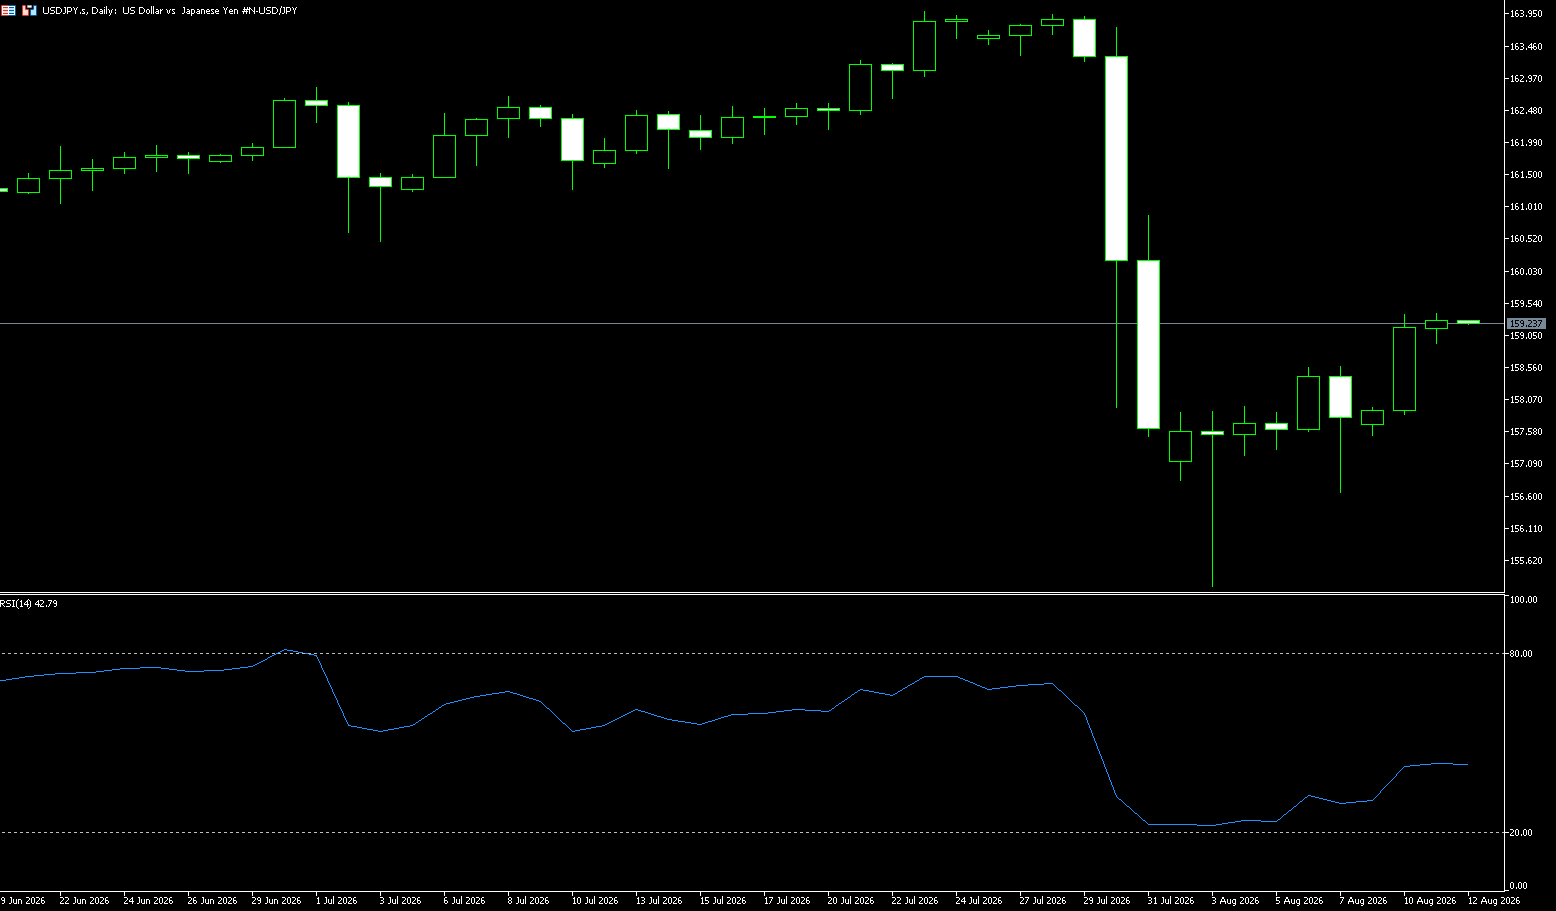
The USD/JPY pair held above 159.00 on Tuesday, dragged down by a renewed weakening of the US dollar. However, the pair's decline appeared to be limited by concerns about Japan's deteriorating fiscal situation and the large interest rate differential between Japan and other major economies, factors that weakened the yen. The core contradiction facing the yen stems from the increasingly sharp interplay between the Bank of Japan's efforts to normalize monetary policy and growing political resistance. On one hand, the summary of the Bank of Japan's June policy meeting demonstrated its firm stance on policy normalization. Kazuo Ueda also explicitly stated that the pace of tightening would be accelerated if necessary, a hawkish signal that directly catalyzed a brief rise in the yen. On the other hand, the fiscal expansion policy led by Prime Minister Sanae Takaichi is constraining the central bank. More seriously, Japan recorded its first current account deficit in nearly 18 months, while business leaders called for exchange rate stability due to the yen's weakness pushing up import costs, deepening the pressure on the yen from a fundamental economic perspective.
Technically, the sharp two-way fluctuations of USD/JPY have left a clear trail on the chart. At the start of the week, a brief dip triggered by intervention rumors found support near the 200-day simple moving average at 158.14 and the psychological level of 158.00. The strength of buying support in this area will be a crucial test of market sentiment in the near term. The long-tailed candlestick pattern indicates strong buying interest at lower levels, but the risk of a sustained bullish trend remains. On the upside, the next key challenge lies at the turning point near 160.00 (a psychological level) and 160.88 (the high of July 31st). On the downside, support can be seen at the double-top neckline area near 158.55, followed by the support zone around the 200-day simple moving average at 158.14. Close attention should be paid to the latest developments in the policy game between the Bank of Japan and the government; any renewed signs of substantial intervention risk could lead to a retest of the 158.00 support area or even lower.
Today, consider shorting the US dollar at 159.46, with a stop-loss at 159.60 and targets at 158.50 and 158.60.
EUR/USD
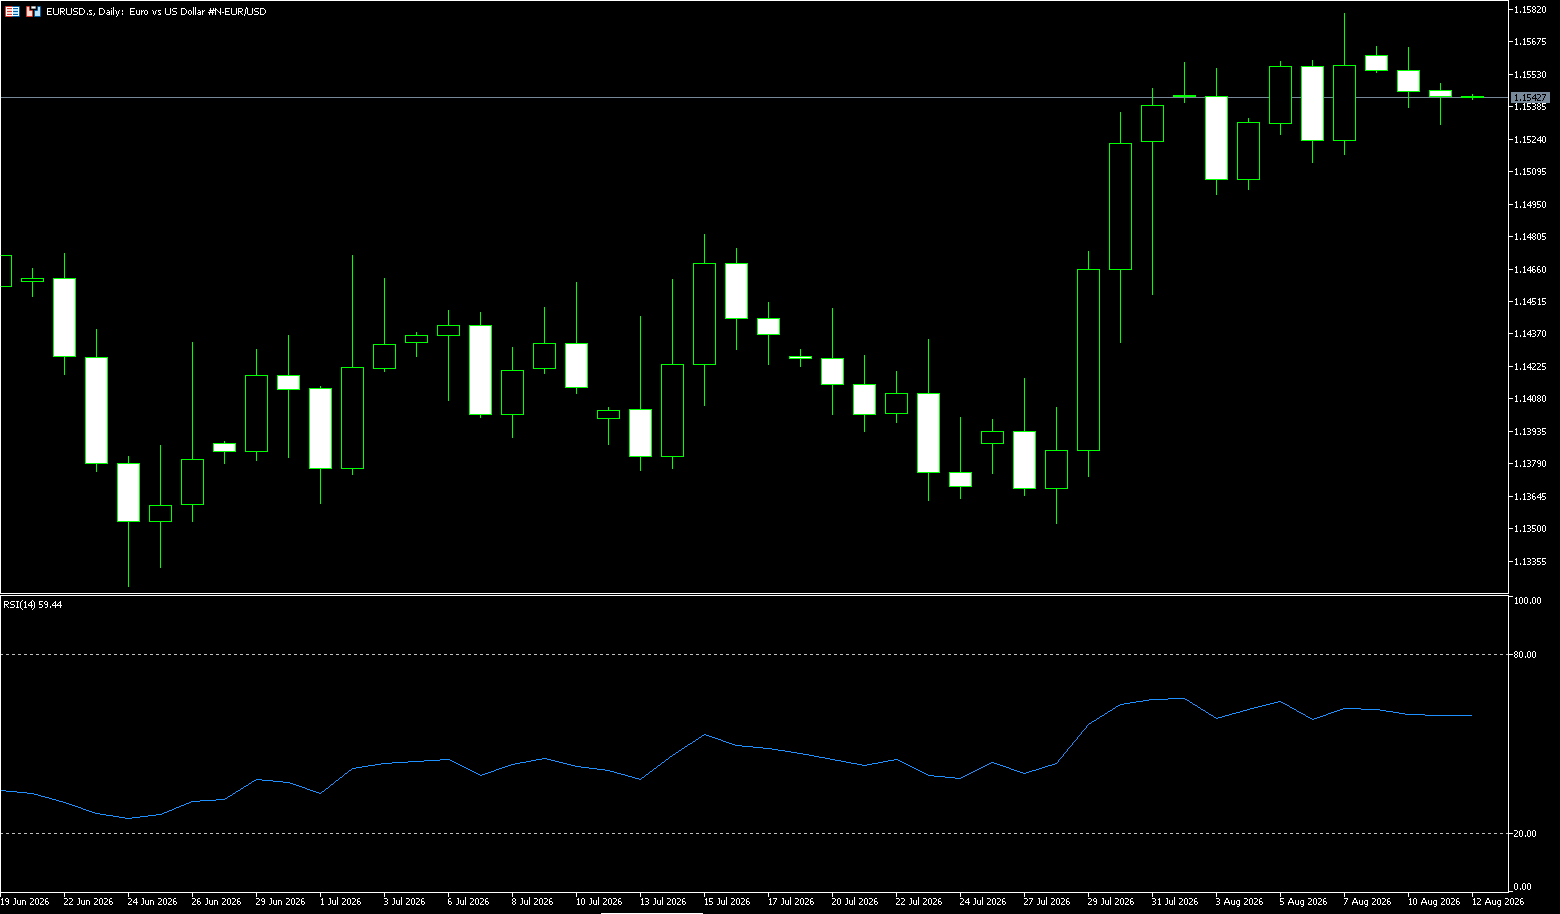
During Tuesday's Asian session, the EUR/USD pair struggled to gain any meaningful momentum, stabilizing around the 1.1540-1.1550 area. Traders appeared reluctant to make aggressive bets, opting to await further developments in the Middle East crisis and the release of the latest US inflation data this week. Nevertheless, spot prices remain far from their highest levels since June 17th, reached last Friday. A disappointing US non-farm payroll report forced investors to lower their expectations for an immediate Fed rate hike. This, in turn, failed to help the dollar extend its modest gains from the previous day and provide support for the EUR/USD pair. Therefore, market focus will shift to the US Consumer Price Index (CPI) and Producer Price Index (PPI), to be released on Wednesday and Thursday, respectively. These data will provide further clues about the Fed's future policy path and influence the dollar and the EUR/USD pair.
Despite a slight decline in the EUR/USD pair during the day, it remains within its recent upward channel. The pair had previously approached its monthly high, and the pullback is more of a technical correction than a trend reversal. Technically, there is strong buying support around the 1.1500 level. A break below this level could lead to further declines towards the 1.1450 area. However, ahead of the CPI data release, the pair is expected to maintain a slightly bullish consolidation pattern. If the US dollar continues to be under pressure, the EUR/USD pair could rise further, with the next targets at 1.1581 (the August 7 high) and 1.1620 (near the monthly high). However, ahead of the CPI data release, the pair is expected to maintain a slightly bullish consolidation pattern.
Today, consider going long on the Euro at 1.1530, with a stop-loss at 1.1520 and targets at 1.1575 and 1.1580.
Stock Analysis:
Australian ASX 200 Stock Index
Basic Market Overview:
The Australian ASX 200 index rose 18 points, or 0.2%, to close at 9,251 on Tuesday, ending a two-day losing streak. Market sentiment improved as the Reserve Bank of Australia, as expected, kept the cash rate at 4.35% and reiterated its vigilance regarding entrenched inflation, which continues to have an impact on the economy. Traders largely ignored weak business confidence in July, which remains well below pre-US-Israel conflict levels in February. They also overcame a significant drop in US futures after lackluster trading on Wall Street on Monday, anticipating inflation data on Wednesday.
Gains in energy and mining, healthcare, technology, and consumer durables outpaced declines in logistics and retail. BHP Group rose 0.7%, Rio Tinto rose 0.5%, while Woodside Energy surged 3.8% and Santos rose 5.4%. Shares of an Australian company surged 17.5% after Hanwha of South Korea offered up to $1.2 billion to acquire its U.S. shipbuilding division.
Sector Performance:
Leading Sectors:
• Energy: A significant surge, with Santos +5.4% and Woodside Energy +3.8%, directly catalyzed by stronger oil prices;
• Healthcare: Buying at lower levels led to a rebound in CSL and rehabilitation equipment stocks;
• Materials (Mining): BHP +0.7% and Rio Tinto +0.5%, with iron ore prices remaining relatively stable, providing support for the index.
Leading Sectors:
• Retail and logistics sectors weakened; large financial and banking sectors showed mixed performance, lacking proactive buying;
• Domestic technology stocks remained weak.
Technical Analysis:
The ASX200 closed at 9250 points, up 18 points, or +0.20%, ending a two-day pullback; the intraday range was 9232–9283 points. The Reserve Bank of Australia (RBA) maintained the cash rate at 4.35%, as expected by the market. Its hawkish stance reiterated persistent inflation and did not rule out further rate hikes, further delaying market expectations for a short-term rate cut. Investors disregarded weak July business confidence data, focusing instead on overnight commodity performance and awaiting Wednesday's US CPI inflation data. Overnight, US stocks were lackluster, with the market anticipating the US CPI figures. The Australian dollar (AUD/USD) remained in a narrow range around 0.705, offering little impact on resource stocks.
The index is in an upward channel, holding above the 50-day moving average; the RSI is in the 61 range, not yet severely overbought, and still has upward momentum, but approaching historical highs, the upward momentum is gradually weakening; Wednesday's market scenario forecast—Optimistic scenario: Stable overnight external sentiment → Opening test of 9285, then a push towards 9300; Cautious scenario: US CPI expectations trigger safe-haven demand and a decline in commodities → Under pressure, a pullback to test the 9220 support level; Pessimistic scenario: A decisive break below 9175, entering a short-term consolidation and correction.
Trading Strategy:
Trading Strategy (Short-term Trading Perspective)
Bull Strategy
• Conservative: Buy lightly if the price retraces and stabilizes in the 9210–9225 range;
Target: 9280 → 9300; Stop Loss: Below 9170.
• Aggressive Strategy: Buy if the price breaks and holds above 9290, with a target of 9330-9350; stop loss at 9260.
Bearish Strategy
• Under Pressure Strategy: If the price rebounds to 9280-9300 and encounters resistance, attempt a short position; target 9230→9200; stop loss above 9315.
Key Risk Warnings:
**US CPI Inflation Data (Wednesday Evening)** Higher-than-expected inflation will reinforce expectations of higher interest rates from the Federal Reserve, putting pressure on global risk assets, and the ASX200 is likely to follow suit; lower-than-expected inflation will be bullish for the stock market. This is the biggest variable this week.
Commodity Volatility Risk** The ASX200 has a very high weighting in resource stocks; a rapid decline in iron ore and international crude oil will directly drag down the index; at the same time, closely monitor changes in expectations for the Chinese economy.
RBA Policy Tail Risk** The RBA retains the option to raise interest rates; if inflation rises again, it will continue to suppress stock market valuations, negatively impacting the banking, real estate, and consumer sectors.
China's Shanghai Composite Index
Basic Market Overview:
On Tuesday, the Shanghai Composite Index fell 0.82% to close at 3,934.1 points, while the Shenzhen Component Index fell 0.40% to close at 14,259.4 points, as investor sentiment weakened due to waning optimism about a short-term easing of tensions between the US and Iran. Market caution intensified after President Trump demanded that Iran compensate victims of the conflict, while Tehran sought reparations for recent attacks by the US and Israel. The stalemate has dimmed hopes for a swift reopening of the Strait of Hormuz, continuing to fuel concerns about shipping disruptions and global risk sentiment.
Regarding monetary policy, the People's Bank of China did not conduct any seven-day reverse repurchase operations on Tuesday, marking the first pause in short-term liquidity injections since June. AI-related stocks led the decline, including North China Semiconductor (-1.83%), Shenghong Technology (-4.01%), Cambricon Technologies (-2.97%), and Hygon Information Technology (-1.18%), as investors shifted towards defensive sectors amid volatility in the AI field.
Sector Performance:
Leading Sectors
Pharmaceuticals (Innovative Drugs, Pharmaceutical Distribution, CRO)
The strongest performing sector throughout the day, with weight-loss drugs and retail pharmacies repeatedly active; funds favored defensive plays and policy expectations, with Baihua Pharmaceutical hitting consecutive daily limits, and Laobaixing and Kaikai Industry also reaching their daily limits.
MLCC / Passive Electronic Components
An upstream sub-sector of AI hardware, this sector saw multiple consecutive days of gains, with Shuangxing New Materials and Jiemei Technology hitting their daily limits; a low-priced branch within the technology sector, characterized by high-low rotation.
Robotics / Reducers
Afternoon saw capital inflows, with unusual activity in the humanoid industry chain and a recovery in market sentiment.
Leading Sectors
Non-ferrous Metals (Leading the Market Decline)
Precious metals (gold), energy metals, industrial metals, and rare earths all experienced a sharp decline; stocks that had previously risen significantly saw large-scale profit-taking, with Zijin Mining, Chifeng Gold, and Luoyang Molybdenum among the biggest losers.
Commercial Aerospace, Semiconductor Materials, and STAR Market Weighted Stocks
The STAR Market 50 index fell sharply by 1.63%, indicating loosening of high-priced technology stocks.
Some high-valuation growth stocks, particularly those in the computing power and optical module sectors, faced pressure during the market correction, experiencing a pullback after an initial surge.
Technical Analysis:
The Shanghai Composite Index closed at 3934.09 points, down 0.82%. Intraday range: High 3966.39 | Low 3930.64. Shanghai market turnover: 1.0667 trillion yuan; total turnover of both Shanghai and Shenzhen stock exchanges was 2.32 trillion yuan, a significant decrease from the previous day. Key market characteristics: Technical signals: The five-day winning streak ended, with the index encountering resistance at the yearly moving average, closing with a medium-sized bearish candle. The index failed to turn positive during the session, indicating a significant weakening of short-term bullish momentum; the index retraced to the 5-day moving average. Domestic capital saw a significant net outflow, with funds concentrated on profit-taking in previously surging sectors such as non-ferrous metals, precious metals, military, and high-flying computing power. Market sentiment was characterized by more stocks declining than rising (over 3700 stocks fell), with many short-term limit-up stocks breaking their upward trend, and thematic rotation being extremely rapid, leading to increased losses for those chasing high prices. The ChiNext index bucked the trend and closed higher, but sector performance was severely divergent. The core conclusion is that after a continuous rebound, profit-taking has led to a concentrated influx of funds, prompting a proactive consolidation phase before attempting to break through the 4000-point mark, shifting from a one-sided rebound to a range-bound trading pattern.
Short-term moving averages remain in a bullish alignment, but the appearance of a high-level bearish candlestick with reduced volume indicates weakening upward momentum. Trading volume in both Shanghai and Shenzhen markets has returned to above 2.45 trillion yuan, representing a return of funds and a high degree of credibility to the rebound. Tomorrow morning, a slight dip is expected to test support around 3910, followed by consolidation and recovery, with the overall trading range between 3910 and 3960. Sector rotation continues, with pharmaceuticals and technology sub-sectors showing repeated activity, while cyclical sectors continue to consolidate.
Trading Strategy:
For Investors with Existing Positions:
• Holding high-flying cyclical stocks, precious metals, and stocks with significant upward momentum: Sell off positions in batches to realize profits and reduce overall position size as the index approaches the 3950 resistance level.
• Holding pharmaceutical stocks and oversold technology hardware (MLCCs, semiconductor components): Focus on individual stock trends, using the 3910 level as a stop-loss point for the index.
• Strict Risk Control: If the index breaks below 3890, reduce all positions to avoid further correction risk.
For investors holding no or light positions and observing:
Two preferred entry points:
1. Retrace to the 3910-3900 range, observe for strong support and the exhaustion of panic selling, then gradually build positions with small amounts.
2. After a breakout and stabilization above 3960 with increased volume, follow the trend.
Key Risk Warnings:
Approaching the 4000-point mark, the divergence between bulls and bears is widening, leading to increased volatility and accelerated short-term profits and losses.
With a flurry of mid-year earnings reports in August, high-valuation stocks without earnings support continue to face the risk of correction.
External exchange rates, overseas market fluctuations, and unexpected news can all change the market rhythm at any time.
Disclaimer: The information contained herein (1) is proprietary to BCR and/or its content providers; (2) may not be copied or distributed; (3) is not warranted to be accurate, complete or timely; and, (4) does not constitute advice or a recommendation by BCR or its content providers in respect of the investment in financial instruments. Neither BCR or its content providers are responsible for any damages or losses arising from any use of this information. Past performance is no guarantee of future results.
More Coverage





Risk Disclosure:Derivatives are traded over-the-counter on margin, which means they carry a high level of risk and there is a possibility you could lose all of your investment. These products are not suitable for all investors. Please ensure you fully understand the risks and carefully consider your financial situation and trading experience before trading. Seek independent financial advice if necessary before opening an account with BCR.
BCR Co Pty Ltd (Company No. 1975046) is a company incorporated under the laws of the British Virgin Islands, with its registered office at Trident Chambers, Wickham’s Cay 1, Road Town, Tortola, British Virgin Islands, and is licensed and regulated by the British Virgin Islands Financial Services Commission under License No. SIBA/L/19/1122.
Open Bridge Limited (Company No. 16701394) is a company incorporated under the Companies Act 2006 and registered in England and Wales, with its registered address at Kemp House, 160 City Road, London, England, EC1V 2NX. Open Bridge Limited acts solely as a payment processor for BCR Co Pty Ltd and does not provide any financial, trading, or investment services on its behalf. Open Bridge Limited's role is limited to payment processing.


 English
 简体中文
简体中文
 繁體中文
繁體中文
 Bahasa
Melayu
Bahasa
Melayu
 Tiếng
Việt
Tiếng
Việt
 ไทย
ไทย
 日本語
日本語
 한국어
한국어
 ភាសាខ្មែរ
 español