


0
US Dollar Index
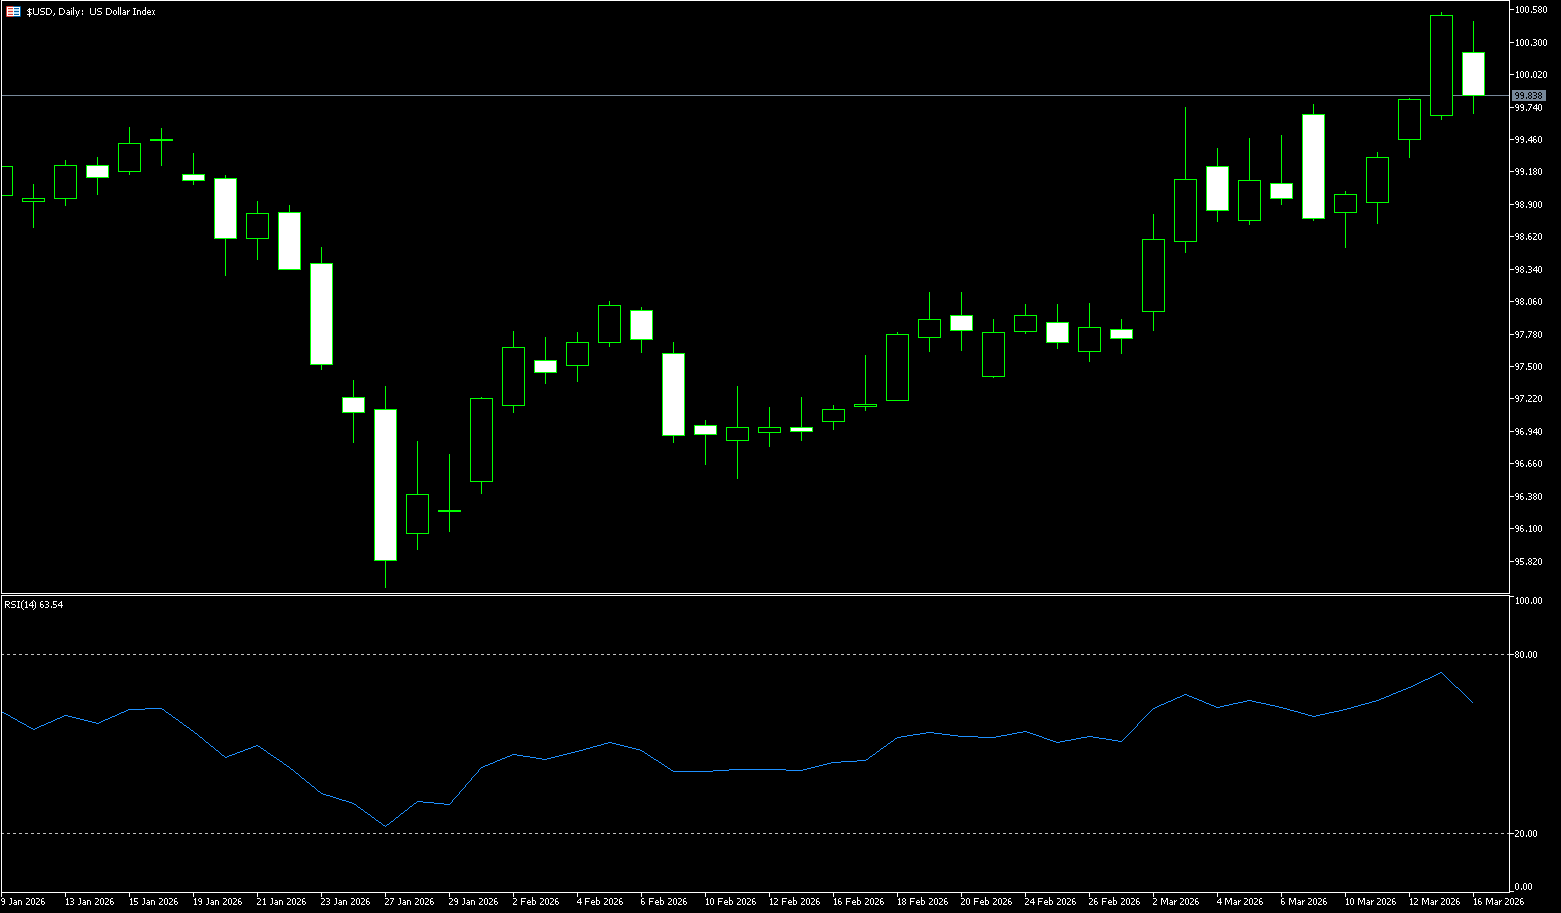
The US dollar climbed across the board on Friday, reaching a high of 100.54, its highest level since November, with a weekly gain of 1.67%. The core driver of this dollar strength lies in its safe-haven asset status. As President Trump vowed a “fierce strike” against Iran, investors reduced their cross-border risk exposure, turning to the US for refuge, putting pressure on energy-sensitive currencies such as the euro. However, the dollar index fell towards 100.00 on Monday, erasing last week's gains, as reports that the US would soon announce a coalition of nations to escort ships through the Strait of Hormuz reduced demand for safe-haven currencies. In the coming week, global investors will focus on the US, with the market eagerly awaiting clear signals about the future path of interest rates from Wednesday's latest economic forecasts and Chairman Powell's remarks.
The dollar is expected to continue its strength in the short term, supported by continued support from geopolitical tensions unless there are signs of easing. Investors should be wary of the risk of a pullback due to sudden peace signals or unexpectedly positive data. This week's economic calendar highlight is the Federal Reserve meeting on March 17-18, where the dot plot and policy wording will be key indicators. Traders are advised to pay attention to the correlation between oil prices and the US dollar and manage positions cautiously. Technically, the US dollar index has stabilized above 100, and the 4-hour chart shows a clear bullish structure. Short-term resistance is seen in the 100.50-101.00 range; a break above this level would open up further upside potential. Support is at 99.30-99.20; any pullback could be seen as a buying opportunity. The RSI indicator is in overbought territory but has not diverged, and the MACD golden cross signal remains valid, indicating overall bullish momentum.
Today, consider shorting the US dollar index at 99.90, with a stop loss at 100.00 and targets at 99.40 and 99.30.
WTI Crude Oil
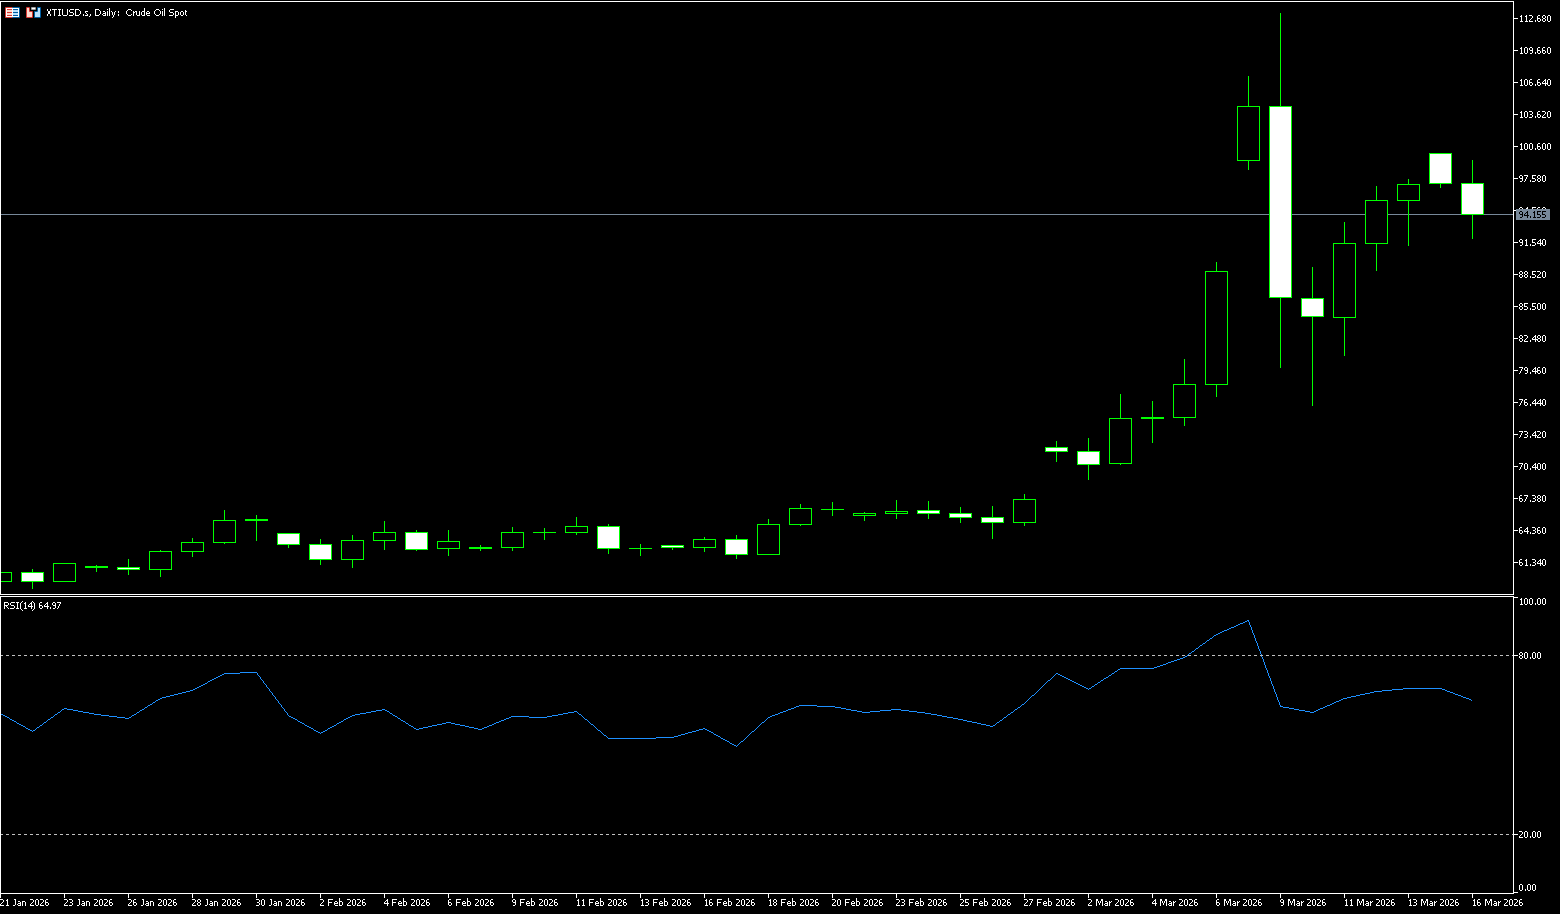
WTI crude oil rose last week, with US crude oil once again approaching the $100/barrel mark. At the beginning of this week, oil prices showed strong upward momentum. Oil prices briefly touched $99, with uncertainty surrounding the situation in Iran dominating price movements. The Strait of Hormuz remains blocked, directly impacting the security of approximately one-fifth of the world's oil transport, and Iran's stance is becoming increasingly hardline. US President Trump refused to predict when the conflict with Iran would end, while emphasizing Washington's readiness to continue strikes until all objectives are achieved. With the situation in Iran continuing to deteriorate, US crude oil may once again rise above $100 per barrel this week. On the international political front, the US's unilateral actions have drawn criticism from its allies. The waiver granted by the US to purchase Russian oil has been explicitly criticized by European allies such as Germany, who believe it sends the wrong signal. Ukrainian President Zelensky also expressed concern, arguing that this move would provide Russia with a huge amount of funds and would not contribute to the peace process.
Today's oil price decline is more like a "false cooling" after a period of high fever. The 30-day waiver for Russian oil only provides limited hedging and cannot reverse the core tension in global supply; the Strait of Hormuz, however, blocks one-fifth of the world's energy lifeline. As long as the conflict in the Middle East continues, $100 will evolve from a ceiling into a new normal floor. On the daily chart, WTI crude oil is at a crucial crossroads, determining its direction over the next few months. The $98.11-$103.15 range forms significant resistance. If geopolitical tensions fuel a bullish breakout, it will retest the previous high of $113.28; conversely, profit-taking could create a secondary high, with initial support at $81.19, and a failure to break down that level leading to a retest of $76.73. The current inverse term structure suggests that extreme scarcity of spot supply remains the cornerstone of the long-term bull market. With both technical and fundamental factors converging, the struggle around the $199 resistance level will be a short-term indicator for oil prices.
Today, consider going long on spot crude oil at $93.00, with a stop-loss at $92.80 and targets at $95.00 and $96.00.
Spot Gold
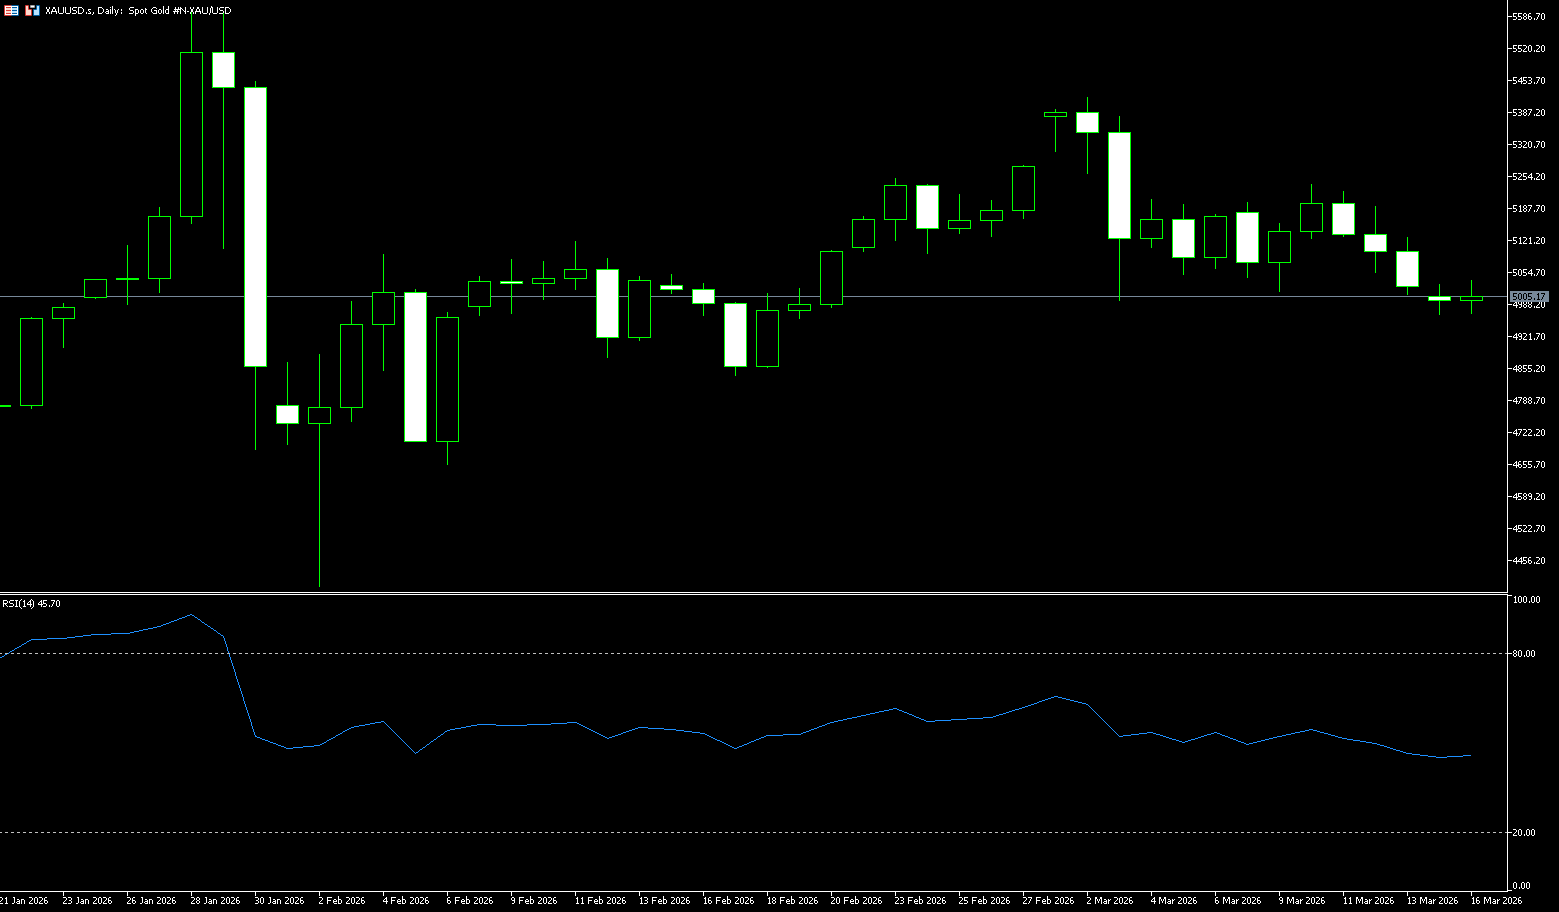
Gold prices fell for the fourth consecutive trading day on Monday during the European session, hovering near $5,000 per troy ounce. Non-yielding metals, including gold, continued to struggle as rising energy prices increased inflationary pressures and reduced market expectations for interest rate cuts by the Federal Reserve and other major central banks. Gold prices were pressured by market expectations that the Fed would keep interest rates unchanged this week and a continued strengthening dollar. Independent precious metals traders stated that although the market remains bullish on the long-term outlook for gold, the main reason for the downward pressure on gold prices is the expectation of tightening monetary policy, as gold has been steadily declining since the outbreak of the conflict in Iran. While gold is considered a traditional tool for hedging against inflation and uncertainty, rising interest rates typically diminish its appeal. Meanwhile, with the resumption of some flights to Dubai, gold outflows from this major global trading hub last week have partially resumed.
From a technical perspective, on the 4-hour chart, gold prices are currently approaching the $5,086-$5,100 level. After a sharp rise triggered by a concentrated outbreak of geopolitical supply risks, it is currently in a brief consolidation phase. Gold prices are currently firmly above the key psychological support level of $5,000, and the 200-period moving average is showing a clear upward trend. This technical signal indicates that the overall bullish trend for gold remains intact, and the long-term bullish pattern has not been broken. However, it is worth noting that the trendline near $5,200 continues to act as strong upward resistance, repeatedly hindering gold's upward progress and becoming the main obstacle to a breakout. Furthermore, the Relative Strength Index (RSI) is currently hovering in the 45-50 range, indicating that the upward momentum of gold is clearly weakening. In the short term, if gold prices can effectively break through the $5,100 resistance level, the next target will likely be $5,200; conversely, if gold prices fall below the key support level of $5,040, the possibility of further declines to $4,955 (the 50-day moving average) should be considered, at which point gold may enter a short-term correction phase towards the $4,900 psychological level.
Today, consider going long on spot gold at 5,000, with a stop loss at 4.9930 and targets at 5,040 and 5,050.
AUD/USD
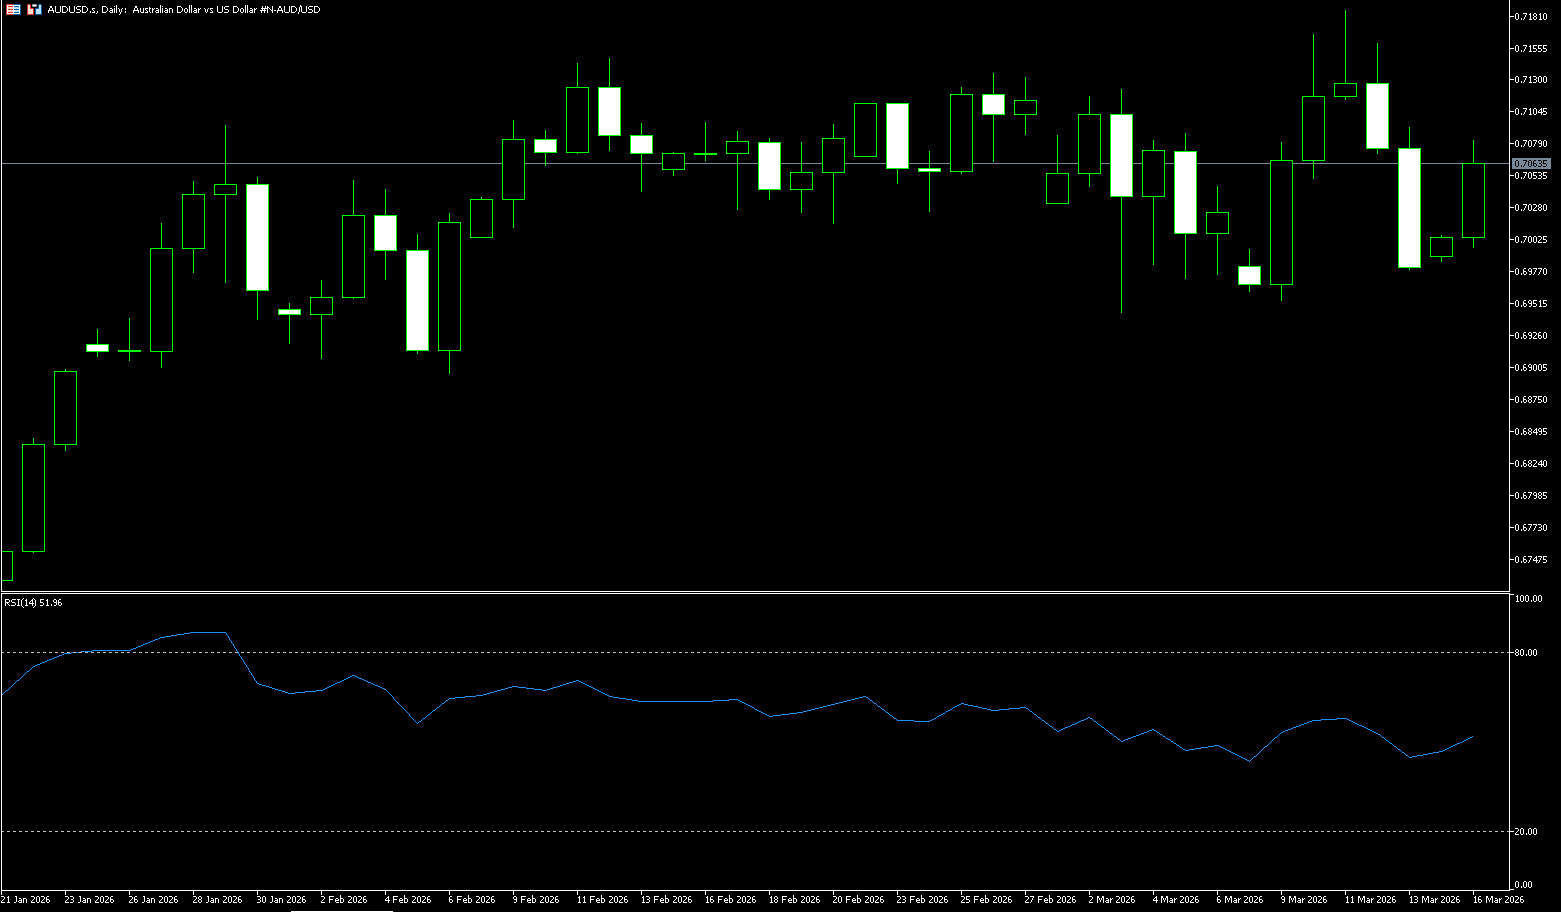
The Australian dollar rose slightly above US$0.7060 on Monday, reversing last week's losses, mainly due to increased investor expectations of consecutive interest rate hikes amid escalating geopolitical tensions in the Middle East. Over the weekend, the US struck military targets near the Strait of Hormuz, a key Iranian oil export hub, and warned that attacks on energy infrastructure could escalate if shipping in the Strait of Hormuz is disrupted. This latest escalation pushed up oil prices and fueled concerns about inflation. The Reserve Bank of Australia is scheduled to announce its latest monetary policy decision on Tuesday, with the market expecting a second consecutive rate hike to 4.1%, and anticipating three more hikes by the end of the year, potentially bringing the policy rate to around 4.6%, above the previous peak of 4.35%. If central banks continue to raise interest rates, investors will focus on their outlook for the future path of tightening policy.
On the daily chart, the Australian dollar/US dollar pair is slightly bullish in the short term, as the price remains above the rising 50-day simple moving average at 0.6962 and consolidates below recent highs. Daily closes are clustered in the upper half of the Bollinger Bands, and the band has flattened, suggesting continued but weakening upward momentum rather than a sell-off top. The Relative Strength Index (RSI) has retreated from overbought territory above 70 to a mid-48, indicating that bullish pressure remains, but the upward acceleration has slowed after the surge at the beginning of the month. Immediate support is at the 50-day simple moving average at 0.6962, followed by 0.7000 (the psychological level). On the upside, initial resistance is at 0.7092, last Friday's high, followed by 0.7150, and then the 0.7200 level (the psychological level).
Consider going long on the Australian dollar at 0.7060 today, with a stop loss at 0.7050 and targets at 0.7100 and 0.7120.
GBP/USD
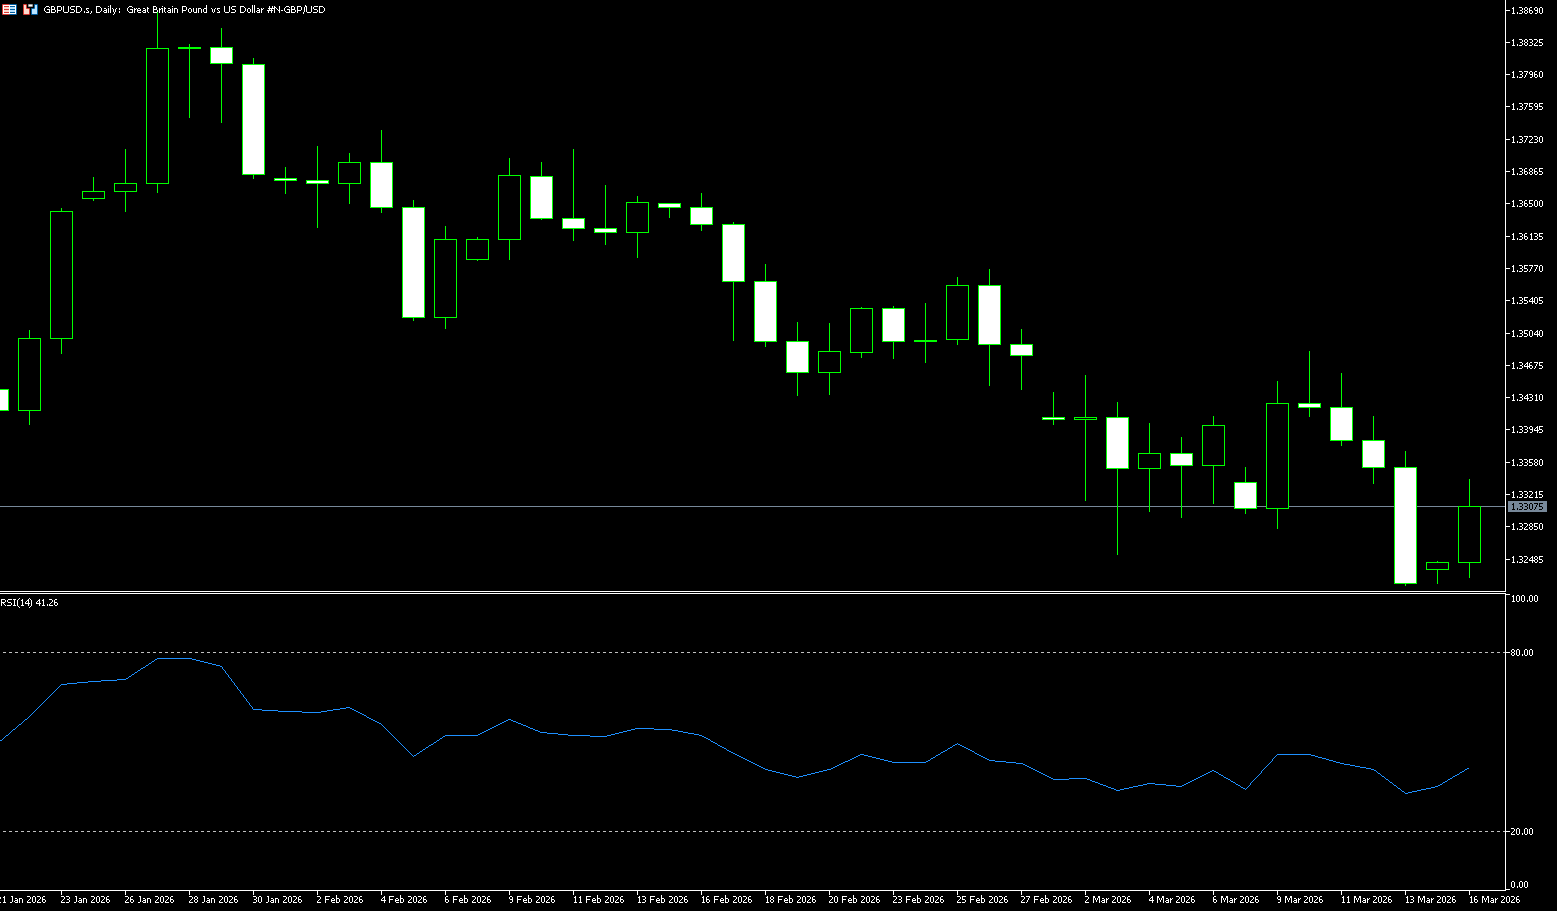
The GBP/USD pair rose slightly after four days of declines, trading around 1.3315 during Monday's European session. However, risk-sensitive currency pairs, including GBP/USD, found some support after The Guardian reported that US Energy Secretary Chris Wright predicted the conflict between the US and Israel and Iran would end "in the next few weeks," potentially allowing oil supplies to recover and easing energy prices. Nevertheless, the pound may still face pressure due to its sensitivity to rising energy costs. Investors are also assessing weak UK economic data and the escalating Middle East conflict and its potential impact on the Bank of England's policy. Furthermore, GBP/USD could extend its losses further as the dollar may strengthen further due to safe-haven demand amid continued tensions in the Middle East and rising oil prices. Despite US President Trump's statement that there were no attacks on oil infrastructure, Iran has warned it might retaliate against any US-related oil facilities in the region.
Technical analysis on the daily chart shows a strengthening bearish bias as the pair has retreated from the upper boundary of a descending channel pattern. Furthermore, the 14-day Relative Strength Index (RSI) hovering above 44 confirms continued downward pressure rather than oversold conditions, focusing on the recent series of intraday lows. The GBP/USD pair is likely to explore lower levels, looking for key support at the three-month low of 1.3253, which was reached on December 3rd. Further declines will put downward pressure on the GBP/USD pair, keeping it near the lower boundary of the descending channel around 1.3140, followed by the 11-month low of 1.3010. On the upside, immediate resistance lies at the 9-day simple moving average at 1.3368. A further break above this level would create a bullish bias and support the GBP/USD pair testing the 20-day simple moving average at 1.3424.
Today, consider going long on GBP at 1.3310, with a stop-loss at 1.3300 and targets at 1.3360 and 1.3370.
USD/JPY
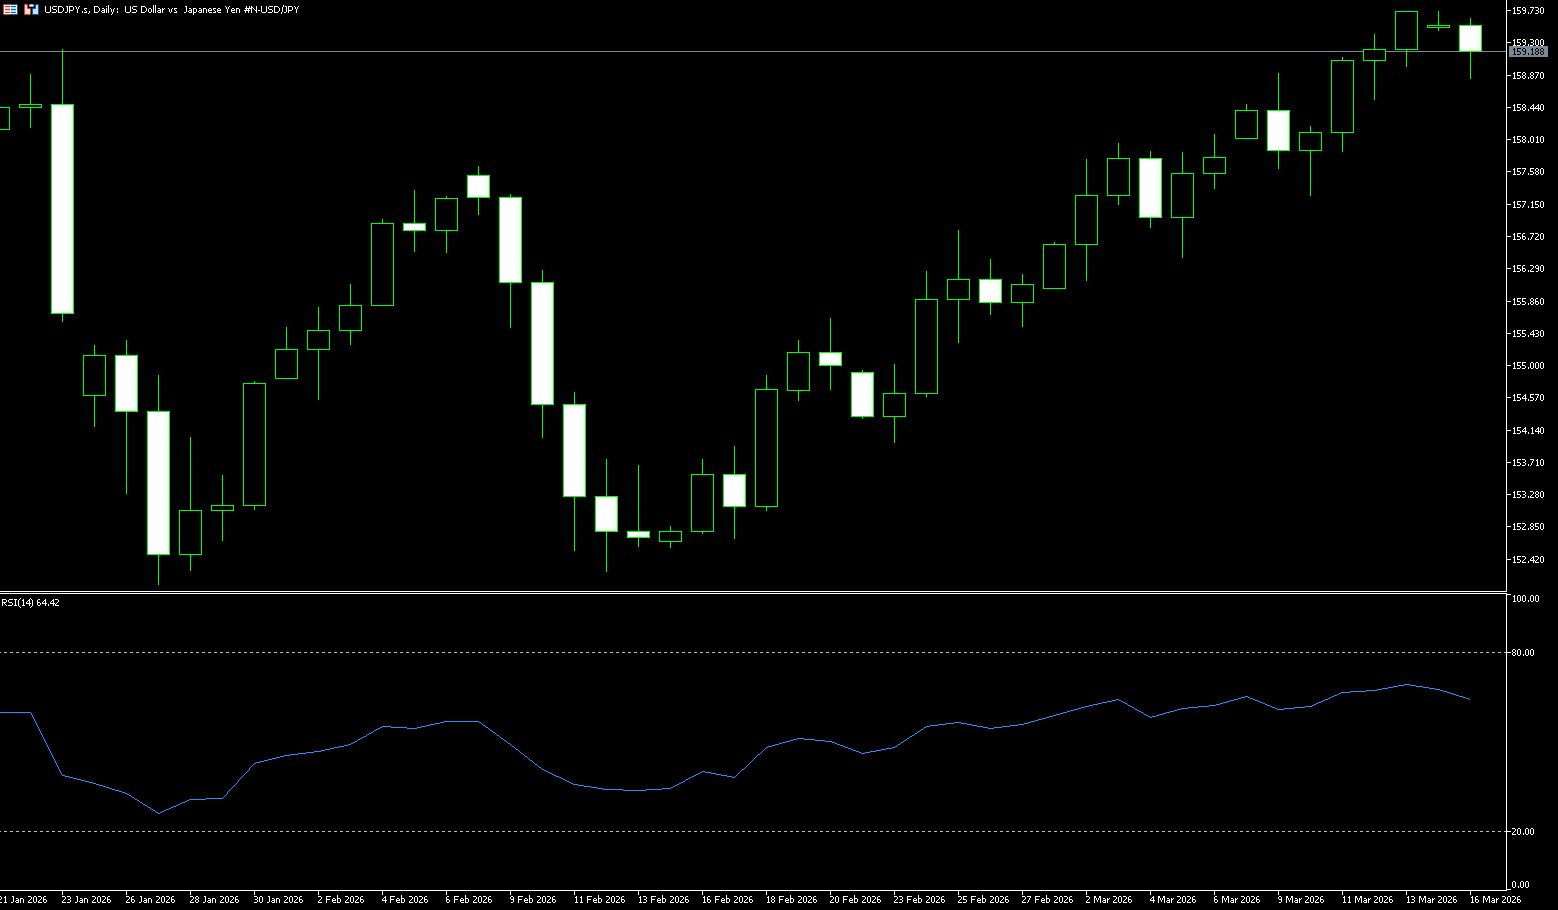
The Middle East conflict escalated over the weekend, creating an opening gap in the forex market. In the USD/JPY pair, the exchange rate fell slightly, trading around 159.10, after Japanese Finance Minister Satsuki Katayama expressed concern about the recent sharp depreciation of the yen and pledged to closely monitor the market and take measures to address excessive volatility. On Saturday, the world awoke to news of a US strike on military facilities on the Strait of Hormuz, Iran's main oil export hub. Tehran swiftly responded with attacks on neighboring countries, targeting locations in the UAE and Iraq. Hezbollah claimed responsibility for the attack on the US embassy in Baghdad. As the weekend unfolded, tensions escalated, leading to large-scale alternating attacks around the Strait of Hormuz. Furthermore, the continued depreciation of the yen has raised market concerns about intervention. The USD/JPY pair rose to 159.75 on Friday, a new high since July 2024. Japanese Finance Minister Satsuki Katayama has warned that Japan is prepared to take necessary measures to address sharp fluctuations in the foreign exchange market.
In the short term, the USD/JPY pair remains within a strong upward channel, and there are no technical reversal signals yet. However, from a fundamental perspective, the yen has entered an "intervention alert zone," and volatility is likely to increase significantly. The market is in an extremely sensitive period, and any rumors about an earlier interest rate hike by the Bank of Japan or specific details about the release of government oil reserves could trigger sharp fluctuations in the exchange rate. If intervention occurs, it could trigger a collective decline in non-US dollar currencies against the yen. If the authorities implement direct intervention, there is a significant potential for a technical pullback. On the daily chart, the emotional volatility caused by the current administration's rise to power last October left a significant gap between 147.45 and 149.02. Based on the rule of thumb that "gaps must be filled," this range will become the primary target for a market pullback, likely triggered by several factors that could trigger stop-loss orders. Resistance Zone: 159.75 - 160.50. 159.75 is the upper edge of the current channel and the recent high, while 160.00 is a psychologically significant level. A break above 159.70 would open up further upside potential. Support Zone: 158.30 - 157.65. 158.30 corresponds to the lower edge of the channel, while 157.65, a previous breakout level, has now become an important support level.
Consider shorting the US dollar at 159.35 today, with a stop loss at 159.54 and targets at 158.50 and 158.40.
EUR/USD
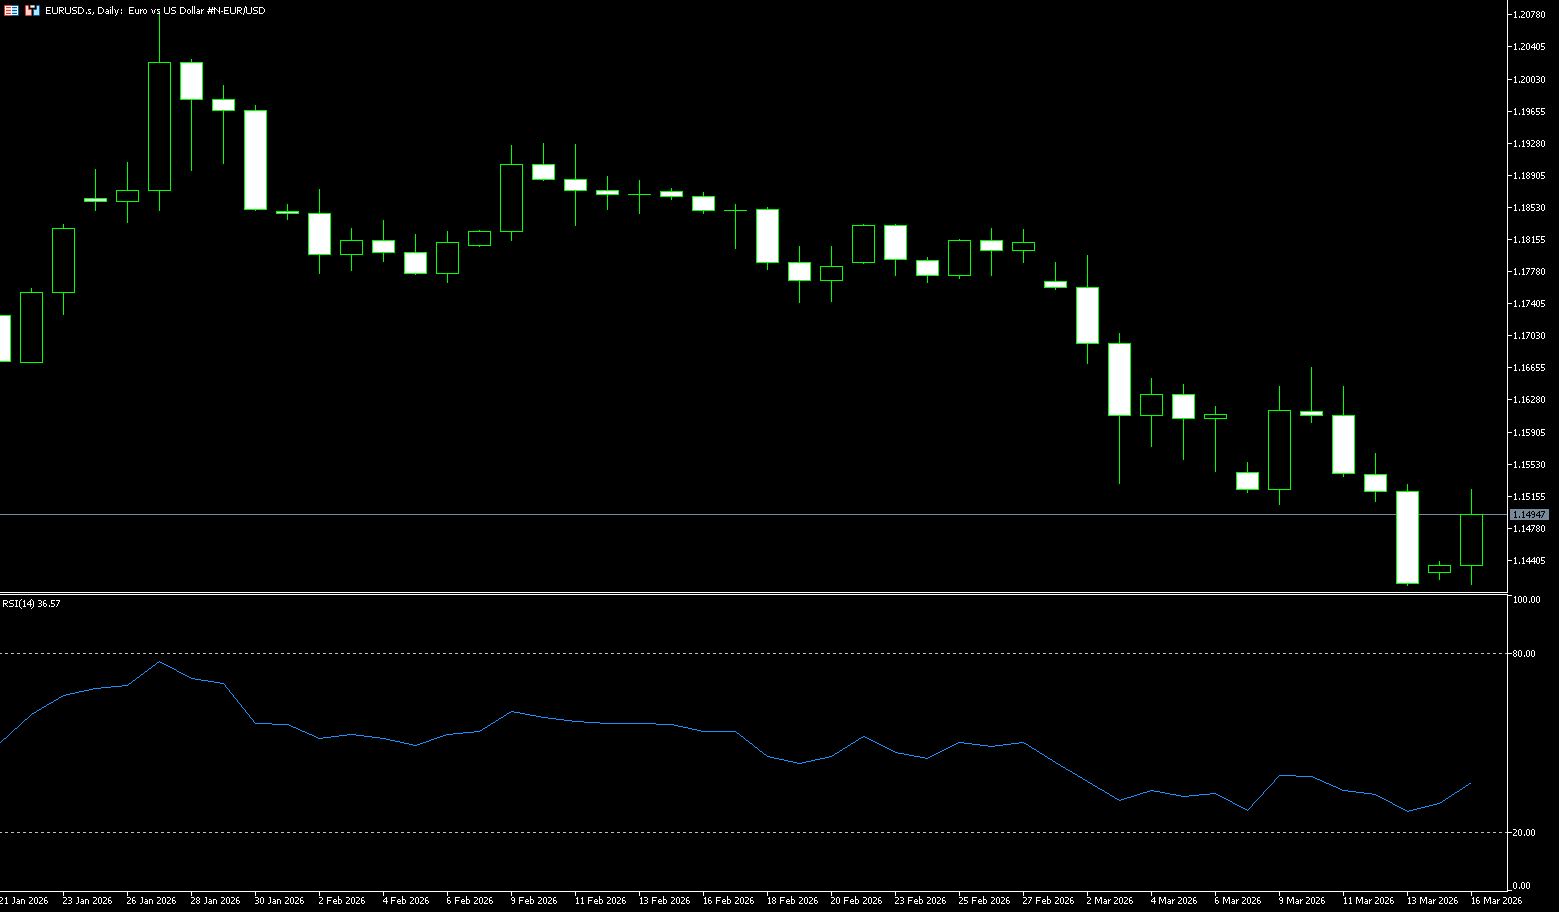
In early Asian trading on Monday, EUR/USD rebounded to around 1.1500 and maintained a defensive stance. However, the potential upside for major currency pairs may be limited as escalating tensions in the Middle East could drive safe-haven inflows. U.S. Energy Secretary Chris Wright stated that he expects the war between the U.S. and Iran to end "in the next few weeks," with oil supplies rebounding and energy costs subsequently falling, according to a report in The Guardian. Meanwhile, the Israeli military indicated it plans to continue military operations for at least three more weeks. Any signs of escalating geopolitical risks in the Middle East could push safe-haven currencies like the U.S. dollar stronger, putting pressure on major currency pairs in the short term. The interest rate decisions of the Federal Reserve and the European Central Bank will be the focus later this week. The Fed is expected to keep interest rates unchanged at its target range of 3.5% to 3.75% at its policy meeting on Wednesday. Meanwhile, the market widely expects the ECB to keep interest rates unchanged on Thursday.
On the 4-hour chart, EUR/USD is trading above 1.1500. The short-term bias remains bearish, as the pair has broken below the converging 20-period moving average at 1.1525 and the 55-period moving average at 1.1574, while the 100-period and 200-period moving averages are above the price around 1.17, further reinforcing the broader downside. Price is flat near the lower Bollinger Band 1, indicating continued selling pressure and compressed downward volatility rather than an oversold bounce. The Relative Strength Index (RSI) is at 34.78, consistent with the bearish tone, but also indicating the risk of a short-term pullback within the descending structure. Immediate resistance is currently at 1.1574 (55-period moving average), with the next higher resistance at 1.1670, closer to the descending long-term moving average. On the downside, the next key support is at 1.1400, a break below which would make the more distant 1.1370 (June 2025 low) the next bearish target. As long as EUR/USD trades below 1.1500, rallies will face selling interest, and the path of least resistance still points to the lower support zone.
Consider going long EUR/USD today at 1.1493, with a stop loss at 1.1480 and targets at 1.1540 and 1.1550.
Disclaimer: The information contained herein (1) is proprietary to BCR and/or its content providers; (2) may not be copied or distributed; (3) is not warranted to be accurate, complete or timely; and, (4) does not constitute advice or a recommendation by BCR or its content providers in respect of the investment in financial instruments. Neither BCR or its content providers are responsible for any damages or losses arising from any use of this information. Past performance is no guarantee of future results.
More Coverage


Risk Disclosure:Derivatives are traded over-the-counter on margin, which means they carry a high level of risk and there is a possibility you could lose all of your investment. These products are not suitable for all investors. Please ensure you fully understand the risks and carefully consider your financial situation and trading experience before trading. Seek independent financial advice if necessary before opening an account with BCR.
BCR Co Pty Ltd (Company No. 1975046) is a company incorporated under the laws of the British Virgin Islands, with its registered office at Trident Chambers, Wickham’s Cay 1, Road Town, Tortola, British Virgin Islands, and is licensed and regulated by the British Virgin Islands Financial Services Commission under License No. SIBA/L/19/1122.
Open Bridge Limited (Company No. 16701394) is a company incorporated under the Companies Act 2006 and registered in England and Wales, with its registered address at Kemp House, 160 City Road, London, City Road, London, England, EC1V 2NX. This entity acts solely as a payment processor and does not provide any trading or investment services.

 English
 简体中文
简体中文
 繁體中文
繁體中文
 Bahasa
Melayu
Bahasa
Melayu
 Tiếng
Việt
Tiếng
Việt
 ไทย
ไทย
 日本語
日本語
 한국어
한국어
 ភាសាខ្មែរ
 español
