


0
Currency & Commodity Analysis:
US Dollar Index
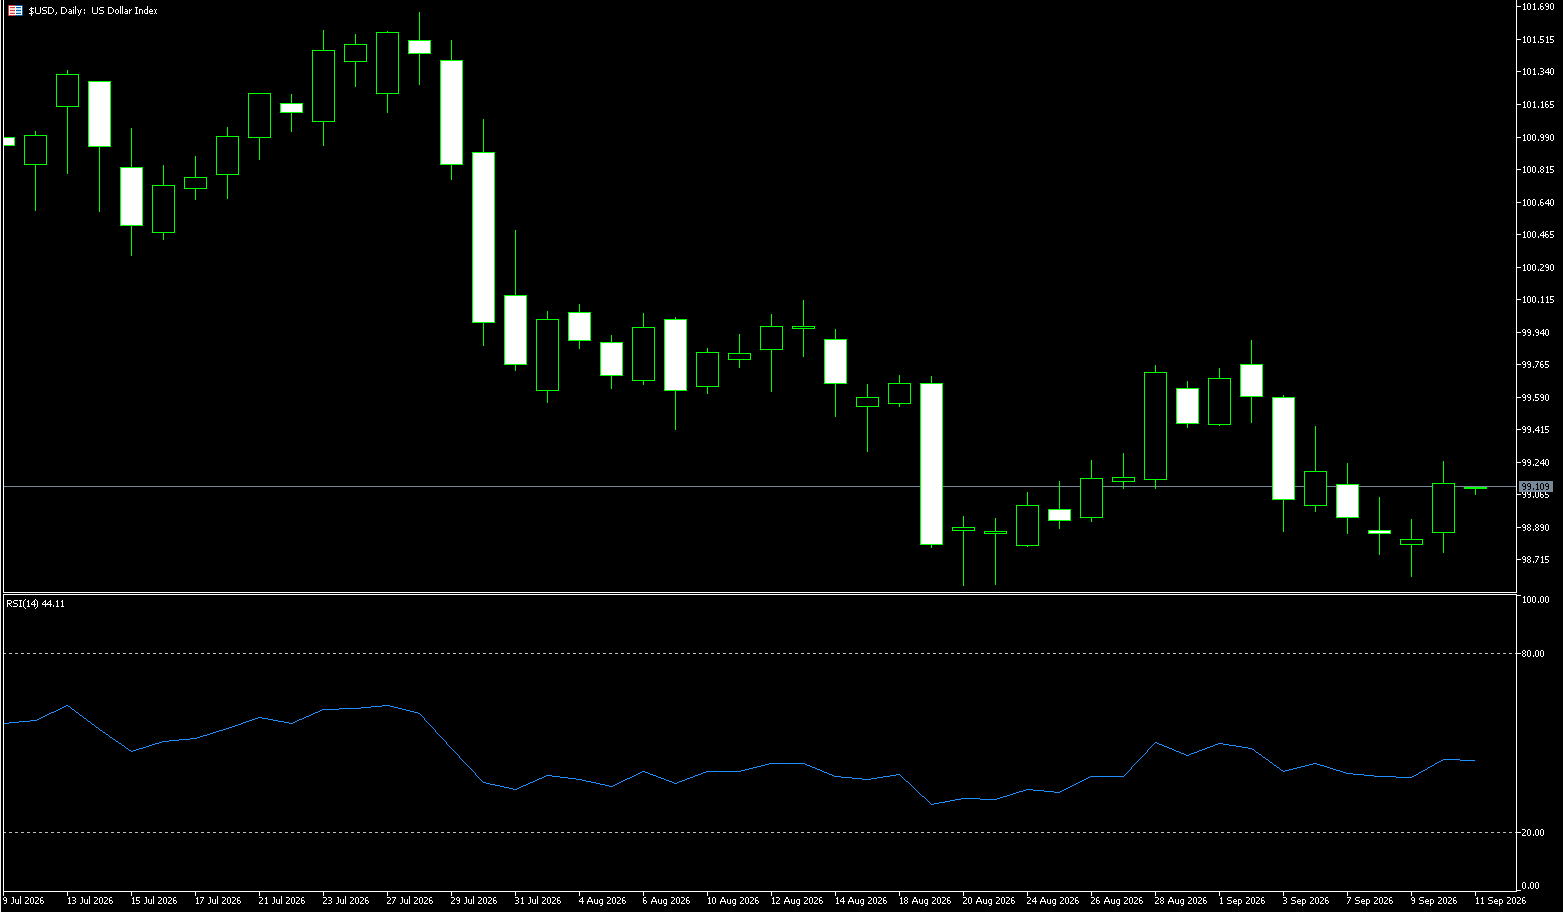
The US Dollar Index held above the 100 level on Thursday, hovering near a seven-week high following a sharp rise in the previous session. This rally was driven by the Federal Reserve's decision to raise interest rates for the first time in three years and its signal of further policy tightening to curb inflation. The Federal Open Market Committee (FOMC) unanimously decided to raise the federal funds rate by 25 basis points to a range of 3.75%–4%, in line with expectations. Fed Chair Kevin Warsh stated that inflation remains too high, while data released last week showed US core inflation rising more than expected in August. Meanwhile, President Trump took to social media to call for a rapid reduction of interest rates to 1% or lower, although he did not directly criticize Warsh. Elsewhere, the Bank of England is expected to keep interest rates unchanged today, while the Bank of Japan plans to raise rates on Friday. Geopolitically, oil prices retreated slightly amid hopes that Saudi Arabia could restore energy flows through its East-West Pipeline.
Overall, the Fed's hawkish rate hike and signals pointing to another hike later this year have provided short-term momentum for the US dollar, pushing the index above 100 and placing non-US currencies under broad pressure. However, the intensity and duration of this tightening cycle fall far short of the 2022 cycle; the path for 2027 remains uncertain, and the market is pricing in further tightening with caution. The prevailing view is that the dollar may have already hit its peak for the year, suggesting this rebound is likely corrective in nature. For traders, the dollar's short-term strength coexists with the expectation of a medium-to-long-term peak. Moving forward, attention should focus on the evolution of rate-hike expectations for October and December, whether inflation data justifies further tightening, and the impact of the Middle East situation and oil prices on the inflation outlook. If it holds firmly above the 100 level, stronger bullish momentum will be confirmed, exposing the next resistance levels at 100.46 (July 31 high) and 101.00 (psychological level). Conversely, a drop below the 100.00 psychological mark would shift market focus back to the 100-day simple moving average at 99.84 and the 99.54 area (Wednesday's low).
Consider shorting the US Dollar Index at 100.32 today; Stop Loss: 100.42; Targets: 100.00, 99.90.
WTI Spot Crude Oil
Crude oil prices fell to around $96.50 per barrel on Thursday—marking a second consecutive day of decline—following reports that Saudi Arabia plans to restore about half of the capacity of its East-West Pipeline within days and resume full operations within six weeks. This key pipeline, which provides an alternative route to the Strait of Hormuz, was damaged in a drone attack last week. Meanwhile, Saudi Arabia has stepped up efforts to transport more crude oil through the Strait of Hormuz, aided by the US military. Separately, US Energy Secretary Chris Wright stated that 18 million barrels of crude oil and petroleum products passed through the Strait of Hormuz earlier this week. In the US, official data showed a crude inventory draw of 640,000 barrels, bringing the total to 423.4 million barrels—a smaller decline than analysts had expected. These figures contrast sharply with the earlier estimate from the American Petroleum Institute (API), which had projected a 7.1-million-barrel build in crude inventories.
While the recent Federal Reserve rate hike has exerted downward pressure on commodities from a macroeconomic perspective, repeated attacks on key Middle Eastern crude oil shipping chokepoints and energy pipelines have kept a geopolitical risk premium firmly supporting oil prices. On a daily chart basis, WTI previously rallied rapidly from around $80, briefly breaking the $100 psychological level and peaking near $102.10 (the September 15 high); the overall medium-term bullish structure remains intact. However, following a period of correction, prices have retreated significantly from their highs in the short term, and upward momentum has weakened compared to earlier levels. Currently trading near $97, the price indicates that bulls are still contending for the key psychological level of $100. On the upside, the initial focus is on the $100.00 (psychological level) to $102.10 (September 15 high) zone; if the price breaks above and holds $102.10, the previous high near $105.80 will once again become a significant resistance level. A further breakout could see the market retesting the $107–$110 range. On the downside, key levels to watch are $95.71 (10-day Simple Moving Average), followed by the area around $93.61 (14-day Simple Moving Average), and finally the $90.00 mark.
Consider going long on crude oil at $96.50 today; stop-loss: $96.30; targets: $98.00, $99.00.
Spot Gold
Gold rose above $4,330 per ounce on Thursday, recovering losses from the previous session as the recent upward momentum in oil prices eased, thereby alleviating inflationary pressure. These movements followed reports that Saudi Arabia plans to restore about half of the East-West Pipeline's capacity within days and resume full operations within six weeks. U.S. Energy Secretary Chris Wright also stated that 18 million barrels of crude oil and petroleum products passed through the Strait of Hormuz earlier this week. However, gold remains under pressure following the Federal Reserve's interest rate hike and signals of further increases before year-end. The Fed raised the federal funds rate by 25 basis points to a range of 3.75%–4%—as expected—marking the first hike in three years. Fed Chair Kevin Warsh also noted that inflation remains high, while data released last week showed U.S. core inflation rising more than anticipated in August.
From a daily chart perspective, spot gold retreated rapidly after surging to near $4,366 and has now returned to the vicinity of $4,330, remaining within a range-bound consolidation pattern in the short term. The current price sits above the 100-day moving average of $4,323, though the technical outlook remains in a corrective phase. The Relative Strength Index (RSI) stands at approximately 46.65; as it has not yet entered deep oversold territory, there is still room for further selling pressure to be released. To the upside, the initial focus is the 10-day moving average near $4,347, which has become a key resistance level for short-term rebounds. Beyond that, attention turns to $4,366 (this week's high); only by reclaiming this level can the bearish daily structure see significant improvement toward the $4,400 mark. To the downside, the psychological level near $4,300 is critical; a breach of this level could see the price seek further support around $4,235 (this week's low) and the $4,200 round-number mark.
Consider going long on gold today at $4,335, with a stop-loss at $4,330 and targets at $4,390 and $4,380.
AUD/USD
During early Asian trading on Thursday, the AUD/USD pair climbed to just above the 0.7100 level. Traders continue to assess the Federal Reserve's interest rate hike and comments from US President Trump. On Wednesday, the Fed raised interest rates to the 3.75%–4.0% range—the first such hike in three years—in line with broad market expectations. Fed Chair Kevin Warsh stated that the move was driven by inflation being "too high and persisting for too long," adding that it was a "prudent" and "responsible" decision. Warsh hinted that further rate hikes might be necessary to curb rising prices, signaling a hawkish stance. Nevertheless, Trump continues to demand that the Fed cut interest rates to 1% or lower. In a post on Truth Social, he wrote: "We are practically 'supporting' every country in the world; this situation cannot continue." Following three consecutive rate hikes earlier in the year, the Reserve Bank of Australia (RBA) has held the official cash rate (OCR) at 4.35%. According to RBA rate-tracking data, the market currently assigns a probability of nearly 76% that the RBA will raise the OCR to 4.60% at its next board meeting.
On the daily chart, the AUD/USD pair maintains a short-term bearish bias, as the price remains below the lower Bollinger Band at 0.7099, while the 100-day simple moving average (SMA) at 0.7078 provides initial potential support just below the market. Momentum has cooled, with the 14-day Relative Strength Index (RSI) slipping toward the 46 level; this suggests that bullish pressure is waning, though the market has not yet entered clearly oversold territory. To the upside, initial resistance lies at 0.7161 (near the 9-day moving average), followed by the 0.7200 level. To the downside, the 100-day SMA at 0.7078 acts as the first support level; a sustained break below this could open the way for a decline toward the 50.0% Fibonacci retracement level at 0.7049, with the 0.7000 psychological support level serving as the next key support.
Consider going long on the AUD at 0.7100 today; stop-loss: 0.7090; target: 0.7150. 0.7140
GBP/USD
GBP/USD has stabilized below the $1.34 mark, hovering near its lowest level since early August, as investors digest a UK inflation report that met expectations and await interest rate decisions from the Bank of England and the Federal Reserve. UK annual inflation accelerated to 3.1% in August from 2.9% in July—in line with forecasts—driven primarily by rising fuel costs. How will the Bank of England's rate decision impact the GBP/USD exchange rate? Although the outcome is uncertain, market participants appear to anticipate that the Bank of England will hold rates steady again this Thursday at 11:00 GMT. Beyond the decision itself, the market will also focus on the voting split among Monetary Policy Committee (MPC) members; any unexpected results could serve as a key driver for the pound. The British pound has come under renewed downward pressure over the past few days, driven entirely by US dollar movements. Should it weaken further, the currency could retest the 100-day simple moving average (SMA)—currently situated near 1.3440—in the short term.
The GBP/USD pair maintains a short-term bearish bias while trading below the 200-day SMA at 1.3454. Furthermore, the spot price has retreated below the key 38.2% Fibonacci retracement level, suggesting that any rebound may remain capped below the confluence of the 50% Fibonacci retracement level and the 200-day SMA (1.3454). Momentum indicators appear to favor further declines; the Relative Strength Index (RSI) is sliding toward the 37 level, while the Average Directional Index (ADX)—hovering around 21—indicates a solid trend. Further weakness could lead to a retest of the July 30 low at 1.3333 and the 1.3300 psychological level in the near term. On the upside, the 200-day SMA at 1.3454 is the first level to watch, followed by the 1.3500 psychological mark.
Consider going long on GBP at 1.3345 today; Stop Loss: 1.3330; Targets: 1.3400, 1.3380.
USD/JPY
The Japanese yen strengthened against major currency pairs on Thursday. USD/JPY fell 0.35% to trade near 155.75 ahead of the Bank of Japan's (BoJ) monetary policy announcement on Friday. Market experts are confident the BoJ will raise interest rates by 25 basis points to 1.25%, noting that the central bank's communication regarding the future rate outlook will be a key trigger for the yen's next move. Markets have largely priced in the BoJ's impending action as a done deal, with observers noting that "a BoJ rate hike looks like a certainty; the debate has now shifted to the tone the central bank will adopt." With a rate hike widely anticipated by the market, investors are increasingly focused on how hawkish or cautious the Bank of Japan's communication will be and what this implies for the policy path through the end of the year. On Friday, investors will also be watching the August nationwide Consumer Price Index (CPI) data, due for release ahead of the policy statement. Regarding the US dollar, traders are increasingly convinced that the Federal Reserve will hike rates once more this year. The Fed raised interest rates by 25 basis points to a range of 3.75%–4.00% on Wednesday and signaled that the next hike is imminent.
On the daily chart, USD/JPY is trading at 155.80, maintaining a short-term bearish bias as the price remains below the 20-day simple moving average (SMA) at 156.90. The pair's failure to reclaim this short-term SMA indicates that any rebound remains limited for now; meanwhile, the Relative Strength Index (RSI) sits near 43, suggesting that downward pressure is stabilizing but remains moderate rather than indicating significantly oversold conditions.
To the upside, initial resistance lies at the 20-day SMA (156.90); this is the first hurdle bulls must clear to alleviate immediate selling pressure and pave the way for a more sustained rally toward 157.65 (the 34-day SMA). Given the lack of nearby structural support levels in the current data set, traders may continue to view intraday rallies toward the SMA as potential selling opportunities until the price clearly closes above that level. To the downside, the market is currently focused on 154.21 (Tuesday's low); a decisive break below this area would expose the pair to further weakness toward 153.37 (this week's low).
Consider shorting the USD today at 156.10; Stop Loss: 156.30; Targets: 155.40, 155.30.
EUR/USD
During Thursday's early European trading session, EUR/USD held steady near 1.1480. Traders continue to assess the Federal Reserve's latest interest rate hike decision. The Federal Reserve raised interest rates by 25 basis points at its September meeting on Wednesday and signaled further hikes in the coming months. Fed official Kevin Warsh supported the decision; policymakers endorsed a hawkish path and projected another rate hike later this year. The Fed's hawkish tone is likely to provide support for the US dollar and exert pressure on this major currency pair. Warsh’s comments were notably more hawkish than anticipated, and his guidance regarding future rate hikes surprised the market, prompting an upward revision of policy expectations and ultimately driving the dollar higher. The European Central Bank also raised rates by 25 basis points last week. The ECB reiterated that, following this second rate hike since the start of the war in Iran, it would not pre-commit to future actions.
On the daily chart, EUR/USD maintains a bearish short-term bias, as the spot price remains below all key reference levels. Both the 100-day simple moving average (SMA) at 1.1550 and the Bollinger Bands' middle line at 1.1603 lie above the current price, indicating that the pair remains under broad downward pressure; even the lower Bollinger Band at 1.1490 is now acting as initial resistance. The 14-day Relative Strength Index (RSI) stands at 35.05, hovering near oversold territory; this suggests that while selling momentum has waned, bears remain in control of the short-term structure. To the upside, initial resistance is found at the 100-day SMA (1.1550), followed by the Bollinger Bands' middle line (1.1603), reinforcing the view that any attempted rebound would face limited upside potential. EUR/USD needs to reclaim this zone to alleviate the current bearish tone; with no significant support levels nearby, a further decline could see the pair drop toward 1.1456 (Thursday's low), with a break below that pointing to the 1.1400 mark.
Consider going long on EUR at 1.1466 today; Stop Loss: 1.1454; Targets: 1.1500, 1.1510.
Stock Analysis:
Australia ASX 200 Index
Market Overview:
The Australian ASX 200 index rose 36 points, or 0.4%, to close at 8,732 on Thursday, extending gains from the previous session as US stock futures rebounded following the Federal Reserve's first rate hike since 2023. Analysts noted that the move bolstered the central bank's credibility and reassured the market of its determination to curb inflation. Domestically, investors continued to hunt for bargains after the market hit a near ten-week low earlier in the week, driving strong performance in the financial, industrial, and logistics sectors. Shares of the "Big Four" banks gained between 1.3% and 2.6% following a volatile week driven by shifting expectations regarding domestic interest rates.
Insurance stocks also advanced, with QBE rising 1.1% and Insurance Australia Group (IAG) up 0.6%. Energy stocks lagged as oil prices retreated following an unexpected rise in US crude inventories, while mining stocks were subdued; BHP saw a slight decline, and Rio Tinto remained flat. Traders are now awaiting a speech by Reserve Bank of Australia Governor Michele Bullock, who is scheduled to testify before Parliament on Friday. Sector Performance:
Top Gainers: Financials (Big Four banks, insurance)—valuation recovery driven by shifting interest rate expectations; Big Four banks rose 1.3%–2.6%. Industrials and logistics sectors also strengthened, driven by bargain-hunting following previous declines.
Top Losers: Energy sector weakened; higher-than-expected US crude inventories pushed down oil prices, weighing on energy stocks. Mining sector showed mixed results: BHP closed slightly lower while Rio Tinto remained flat; overall sentiment regarding commodities was subdued.
Technical Analysis:
Thursday Close: 8732 (+36 points, +0.40%). After hitting a near 10-week low earlier in the week, the index rebounded for two consecutive days—a technical correction following oversold conditions at low levels. Key Event: Focus on RBA Governor Bullock’s parliamentary testimony on Friday; this is the day's primary fundamental driver, directly influencing local interest rate expectations and the pricing of financial stocks. Index Structure: After hitting a cyclical low on Tuesday, the index posted gains for two straight days. Thursday saw a continued rebound with intraday gains, closing near the day's high; this represents a low-level technical recovery rather than a trend reversal. The index has stabilized above the 8700 mark; short-term bearish momentum has waned, though major moving averages continue to act as overhead resistance, indicating a rebound rather than the start of a major new bullish wave. RSI: Recovered from lows to the neutral zone without entering overbought territory, suggesting room for a modest short-term rebound.
Friday Technical Outlook (Two Scenarios): Scenario A (Bullish/Base Case; Assumption: Bullock’s testimony is dovish): The index fluctuates above 8700 at the open and tests the 8775–8800 range. If it firmly breaks above 8800 on high volume, further upside potential opens up, targeting 8825. Scenario B (Bearish bias/Risk scenario: Bullock’s testimony leans hawkish) – The testimony signals rate hikes; the index retreats rapidly, breaking below 8700 without recovering, and tests the 8650 level in the short term. If 8650 fails to hold, the current rebound is considered over, and the index will resume its downward trend to test previous lows. Overall technical outlook: Predominantly range-bound; direction depends on the RBA Governor's speech; avoid one-sided long bets.
Trading Strategy (Short-term perspective)
Short-term strategy (Suitable for intraday or 1–3 day swing trades)
Long Strategy (Light position to play the rebound)
• Entry conditions: Stabilizes near 8700 with a supportive candlestick pattern; Bullock’s speech contains no clearly hawkish remarks.
• Targets: 8775 → 8800; Stop-loss strictly below 8680.
• Constraints: Do not chase highs; avoid entering long positions near or above 8775; prioritize reducing positions at rebound highs.
Short Strategy (Betting against the rebound)
• Entry conditions: Faces resistance at the 8775–8800 zone; stalls (candlestick shows lack of upward momentum) + RBA testimony leans hawkish.
• Targets: 8700 → 8650; Stop-loss above 8830.
Key Risk Warnings:
1. Core Fundamental Risk: Bullock’s parliamentary testimony on Friday is the biggest variable. Hawkish comments would drive up interest rate expectations, causing a rapid pullback in financial stocks and collapsing the index's rebound rally.
2. External Correlation Risk: US stock futures, the US Dollar, and iron ore/crude oil prices will continue to influence the ASX200; weakness in commodities will weigh on heavyweight mining stocks.
3. Technical Risk: The current market movement is defined as a technical rebound following a decline, not a trend reversal. The rebound could end at any time; avoid heavy, long-term long positions. 4. Trading Risk Management: ASX volatility during early trading hours can be amplified by news; ensure position sizes are controlled and stop-loss orders are strictly implemented. Leveraged trading in index options and futures carries higher risk.
New Zealand Stock Index (NZX 50)
Market Overview:
The NZX 50 index rose 134 points, or 1.0%, to close at 13,757 on Thursday, extending gains from the previous session after fresh data showed New Zealand's second-quarter GDP grew faster than expected. The economy expanded by 2.6% year-on-year—surpassing the 2.3% forecast and marking the strongest growth in three years—while quarter-on-quarter growth slowed to 0.2% (above the 0.1% prediction) as oil prices remained high due to the conflict in the Middle East. The broader index climbed, buoyed by rising US stock futures following a market sell-off triggered by Federal Reserve rate hike concerns. However, gains were capped by the Federal Reserve's decision to raise interest rates for the first time since 2023. Traders continue to monitor developments regarding the Iran-US situation and their impact on oil prices.
Sectors such as energy, technology, utilities, real estate, and financials were the primary drivers of the index's rise. Notable gains included Gentrack Group (3.6%), Channel Infrastructure (2.7%), Mercury NZ (2.5%), Westpac Banking Corp. (2.3%), ANZ Group (1.5%), and Infratil (1.4%). Sector Performance:
Leading sectors: Utilities, Energy, Financials, Real Estate, and Information Technology. Defensive and high-dividend sectors led the gains, aligning with local market preferences.
Top-performing stocks: Gentrack Group (+3.6%), Channel Infrastructure (+2.7%), Mercury NZ (+2.5%), Westpac (+2.3%), ANZ (+1.5%), Infratil (+1.4%).
Technical Analysis:
Thursday's close: 13,757 (+134 points, +1.0%). New Zealand's Q2 GDP significantly exceeded expectations—rising 2.6% year-on-year (vs. 2.3% expected) and 0.2% quarter-on-quarter (vs. 0.1% expected)—serving as the primary catalyst for this week's rebound. The index extended Wednesday's gains, closing higher for the second consecutive day and moving away from the previous low-range zone. However, expectations of Federal Reserve rate hikes capped the upside, preventing a late-session surge. The index closed with a solid bullish candle, rising above short-term moving averages and snapping a four-day losing streak; this represents a rebound from lows rather than a trend reversal—classified as an oversold bounce. The intraday low was 13,616, and the close held firm above 13,623 (Wednesday's closing price), shifting short-term support levels higher. Volume: Trading volume expanded moderately during the rebound rather than surging explosively, indicating cautious capital re-entry rather than aggressive buying by large institutional investors.
Friday (September 18) Technical Outlook & Scenario Analysis: Optimistic Scenario (Moderate Probability): Overnight US equity markets and Treasury yields remain stable, with no sharp depreciation in the NZD/USD exchange rate. The NZX50 attempts to test the 13,800–13,840 range; however, due to insufficient volume, it is likely to pull back after an initial rise, struggling to firmly establish itself above 13,840 in a single move. Neutral Scenario (Baseline Expectation; Highest Probability): Consolidation within the 13,680–13,800 range as the market digests the positive GDP data from Thursday. With positive news already priced in, the market has entered a wait-and-see mode, characterized by narrow-range fluctuations while awaiting new catalysts. Bearish/Risk Scenario: Rising US Treasury yields, a sharp drop in US stocks, or oil price spikes driven by Middle East tensions—combined with a weakening NZD—could push the index back down to test the 13,620 support level. A break below 13,620 would signal the end of the current rebound and a return to a downward trend, with a potential target near 13,500. Technical Summary: The market is currently in a low-level rebound phase following a decline; the medium-term bearish structure remains intact. This rebound is a data-driven correction rather than the start of a major new bullish wave. Overhead resistance is significant, and the risk of chasing highs is high.
Trading Strategy:
Bullish Approach: Consider a light long position only if the price pulls back to the 13,680 support area, stabilizes, and there are no significant negative external factors; target 13,780–13,800, scaling out profits. Hard Stop-Loss: Exit immediately if the price decisively breaks below 13,620; do not hold losing positions. Strictly avoid chasing highs above 13,780, as late-stage rallies are prone to rapid pullbacks.
Bearish Approach: Consider a light short position if the price spikes to the 13,800–13,840 resistance zone during early trading but lacks volume support and US stock futures weaken; target near 13,700. Hard Stop-Loss: Abandon the short strategy if the price firmly establishes itself above 13,840.
Key Risk Warnings:
1. External Correlation Risk (Primary Risk): The NZX50 is highly sensitive to overnight US stock market movements and US Treasury yields. A surge in US Treasury yields or a sharp drop in US stocks could lead to a direct gap-down opening. Middle East conflicts driving up oil prices could exacerbate imported inflation in New Zealand, weighing on the local stock market.
2. Exchange Rate Risk: Significant volatility in the NZD/USD exchange rate could influence foreign capital flows and disrupt the local market. 3. Risk of "Sell the Fact": With the GDP data now released, the market is prone to profit-taking on Friday, following the "buy the rumor, sell the fact" pattern.
4. Liquidity Risk: Overall trading volume on the NZX is relatively low; large orders can easily cause slippage, and stop-loss levels may be instantly breached. Strict position control is essential.
Disclaimer: The information contained herein (1) is proprietary to BCR and/or its content providers; (2) may not be copied or distributed; (3) is not warranted to be accurate, complete or timely; and, (4) does not constitute advice or a recommendation by BCR or its content providers in respect of the investment in financial instruments. Neither BCR or its content providers are responsible for any damages or losses arising from any use of this information. Past performance is no guarantee of future results.
More Coverage






2026 © - All Rights Reserved by BCR Co Pty Ltd
Risk Disclosure:Derivatives are traded over-the-counter on margin, which means they carry a high level of risk and there is a possibility you could lose all of your investment. These products are not suitable for all investors. Please ensure you fully understand the risks and carefully consider your financial situation and trading experience before trading. Seek independent financial advice if necessary before opening an account with BCR.
BCR Co Pty Ltd (Company No. 1975046) is a company incorporated under the laws of the British Virgin Islands, with its registered office at Trident Chambers, Wickham’s Cay 1, Road Town, Tortola, British Virgin Islands, and is licensed and regulated by the British Virgin Islands Financial Services Commission under License No. SIBA/L/19/1122.
Open Bridge Limited (Company No. 16701394) is a company incorporated under the Companies Act 2006 and registered in England and Wales, with its registered address at Kemp House, 160 City Road, London, England, EC1V 2NX. Open Bridge Limited acts solely as a payment processor for BCR Co Pty Ltd and does not provide any financial, trading, or investment services on its behalf. Open Bridge Limited's role is limited to payment processing.


 English
 简体中文
简体中文
 繁體中文
繁體中文
 Bahasa
Melayu
Bahasa
Melayu
 Tiếng
Việt
Tiếng
Việt
 ไทย
ไทย
 日本語
日本語
 한국어
한국어
 ភាសាខ្មែរ
 español