


0
US Dollar Index
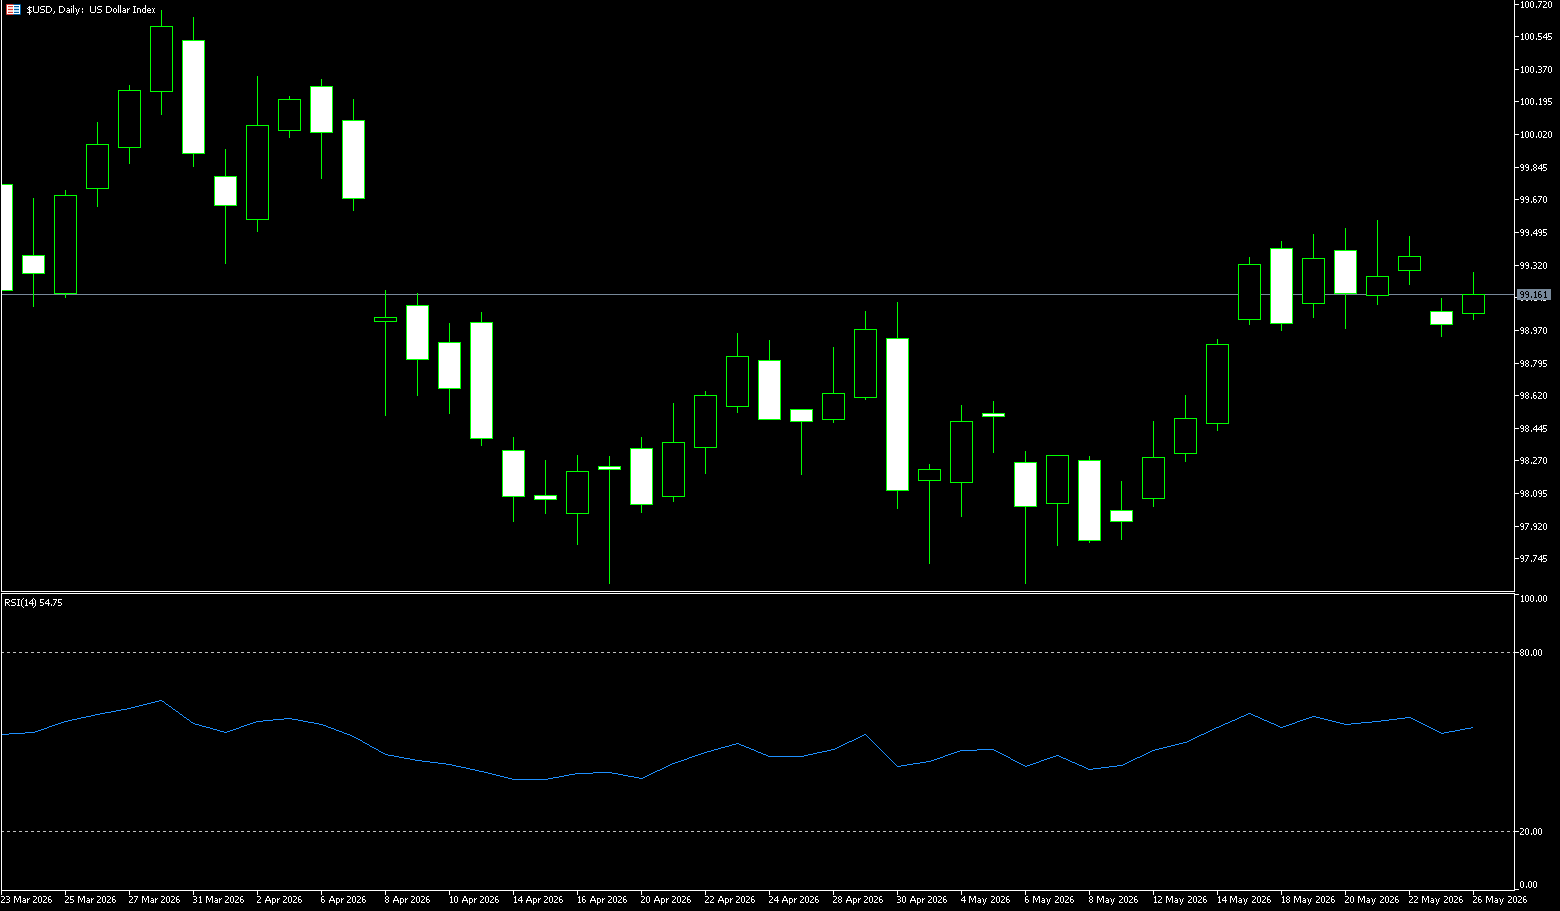
The US dollar opened slightly lower this week, currently hovering around 99, due to reports of progress in US-Iran negotiations and a potential agreement soon to take effect. Trump stated that the terms of a peaceful resolution to the conflict have been largely agreed upon. However, he later indicated he was not in a hurry to reach an agreement, and both sides must finalize all the details. A swift reopening of the Strait of Hormuz would fundamentally alter the foreign exchange market landscape. The dollar's long-term strength is attributed to the increased likelihood of a Federal Reserve tightening monetary policy. As early as the beginning of May, the futures market anticipated a rate hike in April of next year. This expectation subsequently shifted to March, and then to the end of 2026. At one point, the probability of a monetary tightening cycle starting in December exceeded 60%. If oil prices fall, inflation will also decline. This should allow the Fed to revert to its narrative from the beginning of the year, suggesting a possible rate cut after maintaining current interest rates.
From a practical perspective, after months of consolidation near multi-month lows, the US dollar index may be entering a broader recovery phase. If inflation remains high and the Middle East conflict continues to disrupt energy markets, the likelihood of a return to above 100.00 in the coming weeks will increase. Currently, the biggest support for the dollar may simply be that the market may be underestimating the difficulty of the final stages of the inflation battle. The key dividing line is 99.60 as an upward breakout level, and 98.90 as the bulls' defense line; a break below this level would open up downside potential to 98.00-98.50. Technical indicators show a bullish trend but weakening momentum; after falling from the previous high of 60 to around 54, the willingness of bulls to chase higher prices has weakened, entering a period of equilibrium. The MACD: after testing above the zero line, it is converging, with the histogram shortening, indicating weakening bullish momentum; be wary of the risk of a death cross. Technically, the dollar index remains under pressure from 99.52 (last week's high) and 100 (a psychological level), while support lies at 98.64 (the 20-day moving average) and 98.26 (the low of May 13th).
Today, consider shorting the US Dollar Index at 99.25, with a stop-loss at 99.35 and targets at 98.90 and 98.80.
WTI Crude Oil
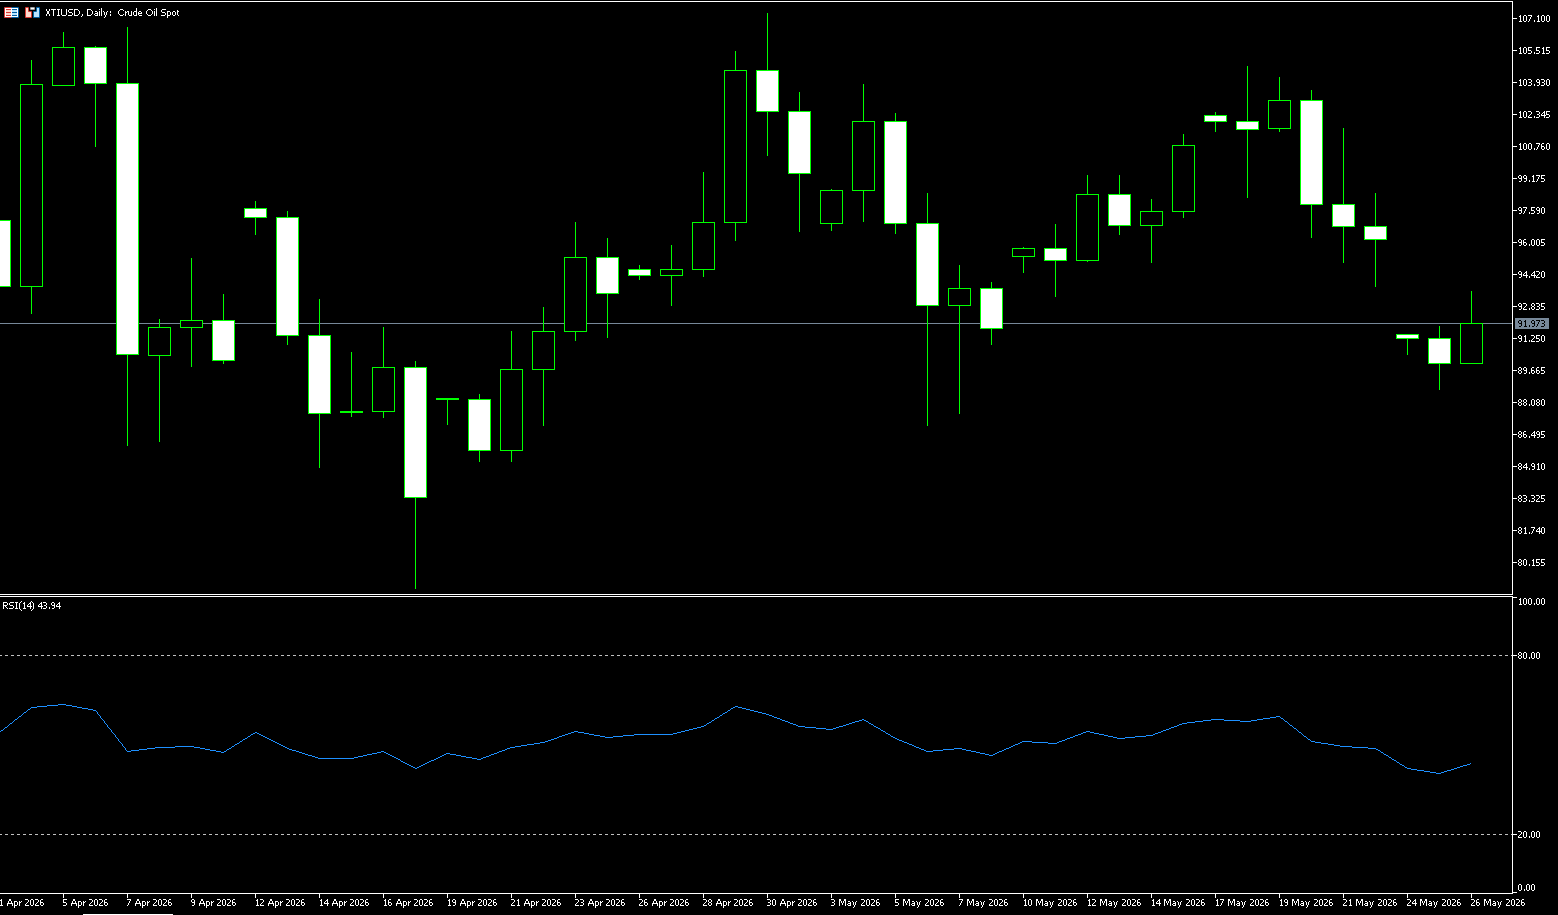
WTI crude oil remained around $92 per barrel on Tuesday, after falling more than 6% in the previous session. Rising optimism about a US-Iran deal that would end the conflict and reopen the Strait of Hormuz continued to put pressure on prices. President Donald Trump said negotiations were progressing well, although he warned of potential new attacks if talks broke down, and a Pakistani mediator reportedly told China that an agreement was imminent. The US and Iran are currently discussing a framework that would extend the ceasefire for about two months, during which Washington would lift the blockade and Tehran would reopen the Strait of Hormuz. However, several key issues remain unresolved, particularly Iran's nuclear program and its demands for control over maritime traffic through this vital waterway. Meanwhile, ongoing tensions around the Strait of Hormuz, including reports of attacks on Iranian vessels by the US and Israel, have kept investors cautious.
The US and Iran are close to reaching an agreement to extend the ceasefire that began in early April for another 60 days. The agreement, presented as a "one-page memorandum," has its core framework largely agreed upon. This potential agreement injects certainty into the volatile Middle East situation, providing short-term support for lower oil prices and improved market risk appetite. Currently, US crude oil has broken below both the short-term upward trend line and the 50-day moving average (a key level for medium-term strength) at $95.40, indicating a significant weakening of medium-term bullish momentum and a shift in market sentiment from bullish to bearish. Whether it can regain and hold above the 50-day moving average in the coming days will be a crucial signal for determining whether the trend has reversed. Support levels below, in order of strength, are: $90.00 (a psychological level); and an important support zone between $87 and $85. A bullish counterattack requires two steps: first, recovering and holding above the 50-day moving average at $95.40; and second, breaking through the 20-day moving average at $98.43 to return to a bullish alignment of short-term moving averages.
Today, consider going long on crude oil at 92.00, with a stop-loss at 91.80 and targets at 94.00 and 95.00.
Spot Gold
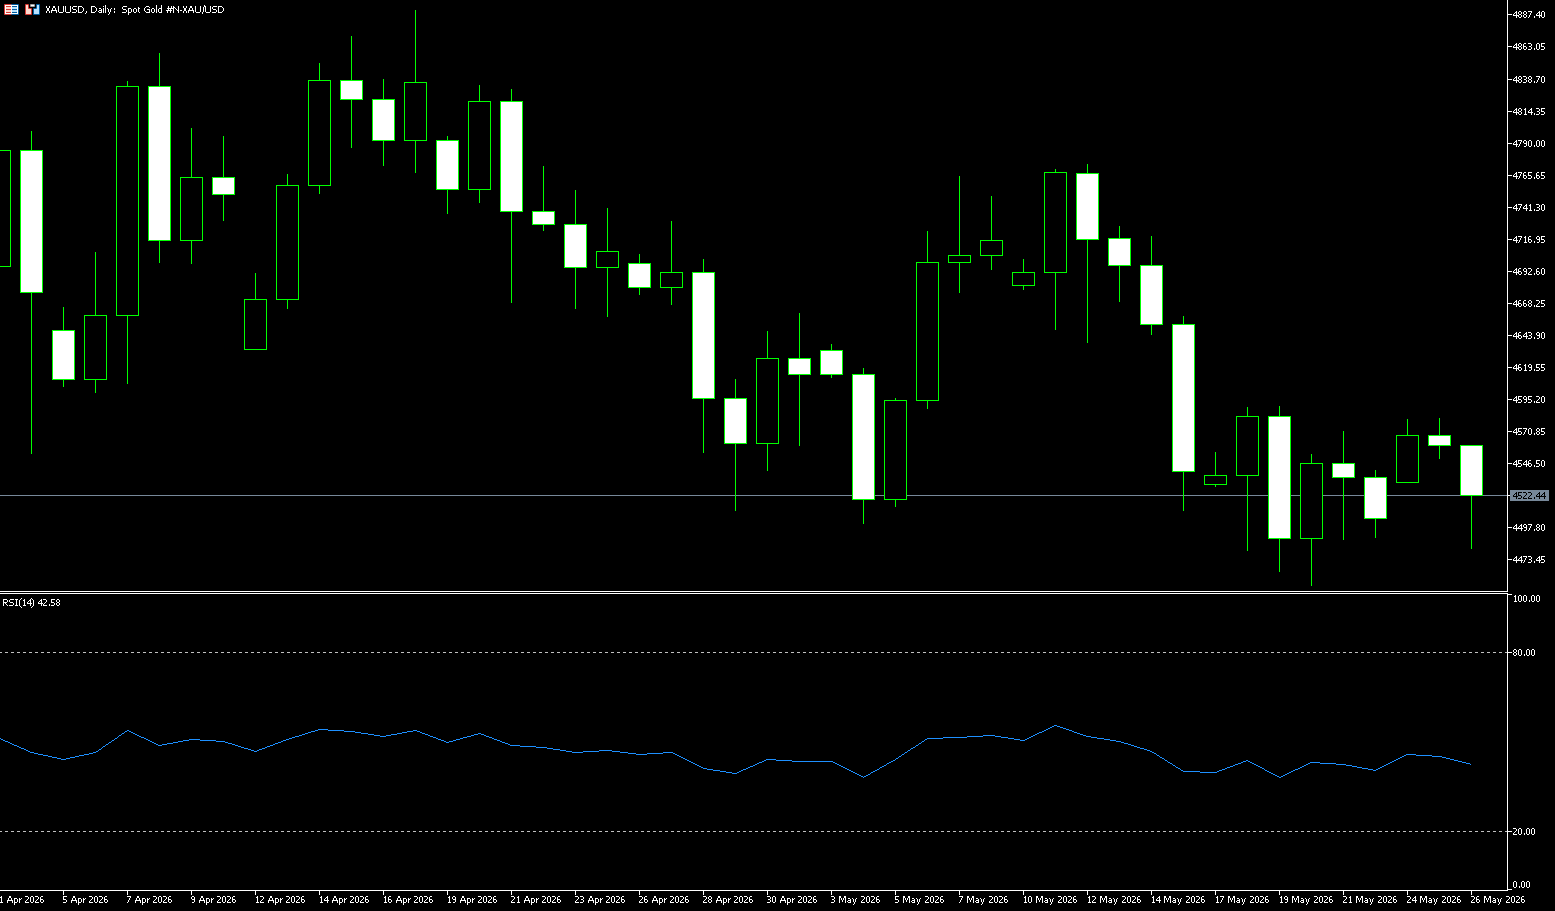
On Tuesday, gold prices traded above $4,500 per ounce, after rising about 1% in the previous session, supported by signs that the US and Iran were close to reaching an agreement that could end the conflict and reopen the Strait of Hormuz. Reports indicate that negotiations between Washington and Tehran focused primarily on extending the ceasefire for approximately two months, during which time the US would lift the blockade, and Iran would allow shipping to resume in the Strait of Hormuz. However, major obstacles remain, particularly regarding Iran's nuclear program and its insistence on controlling maritime traffic in this strategic passage. Meanwhile, a sharp drop in oil prices eased concerns about inflationary pressures and the prospect of further interest rate hikes. Despite the recent rebound, gold prices are still down about 13% since the start of the conflict, as concerns about an energy-driven inflationary shock have strengthened market expectations that central banks may maintain tight monetary policy for a longer period.
From a technical perspective, international gold is currently in a wide-range fluctuation pattern, with clear distinctions between long-term support and short-term resistance. Long-term support is solid: gold prices have consistently held above the 200-day moving average (approximately $4,388), and the fundamental structure of the medium-to-long-term bull market remains intact, providing strong bottom protection for gold prices. Short-term resistance is strong: the 100-day moving average (approximately $4,757) forms direct resistance, and recent rebounds have failed to break through effectively, indicating insufficient upward momentum for bulls in the short term. Indicator signals are weak: the daily RSI (Relative Strength Index) is around 45, in the neutral to weak range; the MACD indicator is running steadily below the zero line, with the histogram slightly turning green. All technical indicators reflect a lack of bullish power in the market, making a range-bound trading pattern the most likely scenario in the short term. Support levels: First support is at $4,500 (recent consolidation platform); strong support is at $4,381 (200-day moving average). A break below this key level would likely trigger a deep correction in gold prices. Resistance levels: First resistance is at $4,580 (early week high); strong resistance is at the 100-day moving average (approximately $4,757). A successful breakout above this range could initiate a new upward trend for gold.
Consider going long on gold today at $4,500, with a stop-loss at $4,495 and targets of $4,550 and $4,560.
AUD/USD
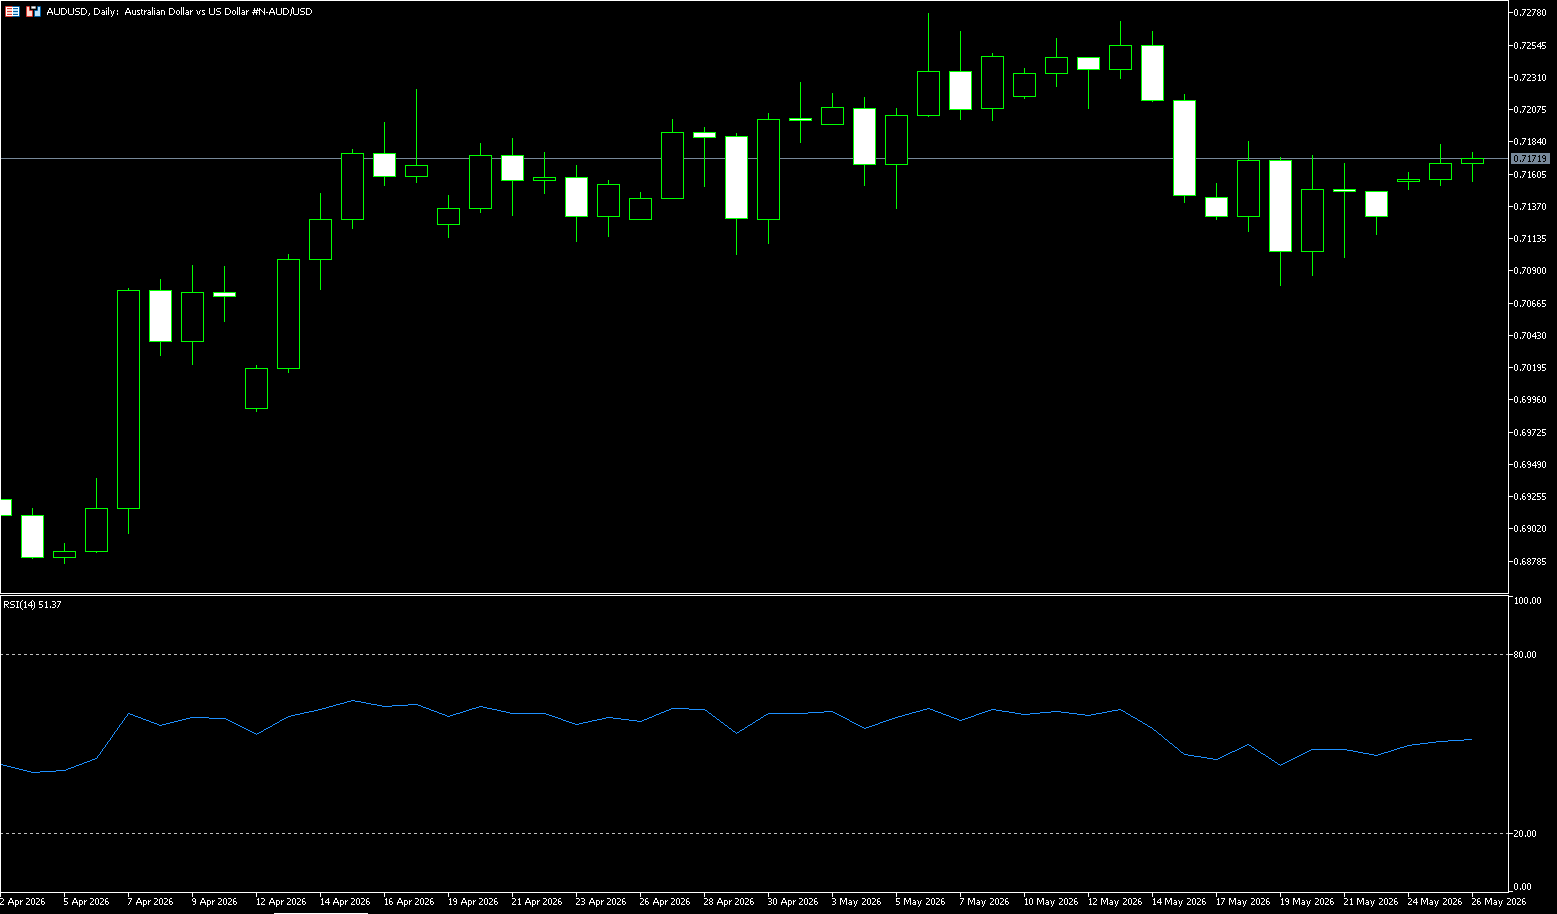
The Australian dollar appreciated above US$0.7160 on Monday, reaching its highest point in a week, as global risk sentiment improved following a near-agreement between the US and Iran. The proposed agreement would reopen the Strait of Hormuz, end hostilities, unfreeze some Iranian assets, and pave the way for further negotiations to limit Tehran's nuclear program. However, President Trump stated that Washington will maintain the blockade of the Strait of Hormuz until a final agreement is reached, and that he is not in a “rush” to reach a deal. In Australia, expectations for further monetary tightening by the Reserve Bank of Australia have diminished due to an unexpected rise in the unemployment rate. The unemployment rate unexpectedly rose to 4.5% in April, up from 4.3% in March, marking its highest level in about four and a half years. According to financial market pricing provided by Westpac, the probability of a rate hike at the next meeting has fallen from 13% after the announcement to just 3%.
From a technical perspective, spot prices appear to have found support above the 38.2% Fibonacci retracement level of the recent corrective pullback, near the highest point since June 2022 reached earlier this month. Meanwhile, the Relative Strength Index (RSI) near 53 is slightly positive, and the slightly positive Moving Average Convergence Divergence (MACD) indicator suggests that upward momentum is accumulating. However, the exchange rate remains in a delicate balance, so it is wise to wait cautiously until follow-through buying appears above key moving averages to prepare for further appreciation. The subsequent upside may encounter immediate resistance at the psychological level around 0.7200, with higher resistance seen at 0.7270 (the high of May 13th). On the downside, a break below the 23.6% Fibonacci retracement level of 0.7124 would expose that level, followed by stronger structural support around 0.7100.
Consider going long on the Australian dollar today at 0.7155, with a stop-loss at 0.7145 and targets at 0.7210 and 0.7220.
GBP/USD
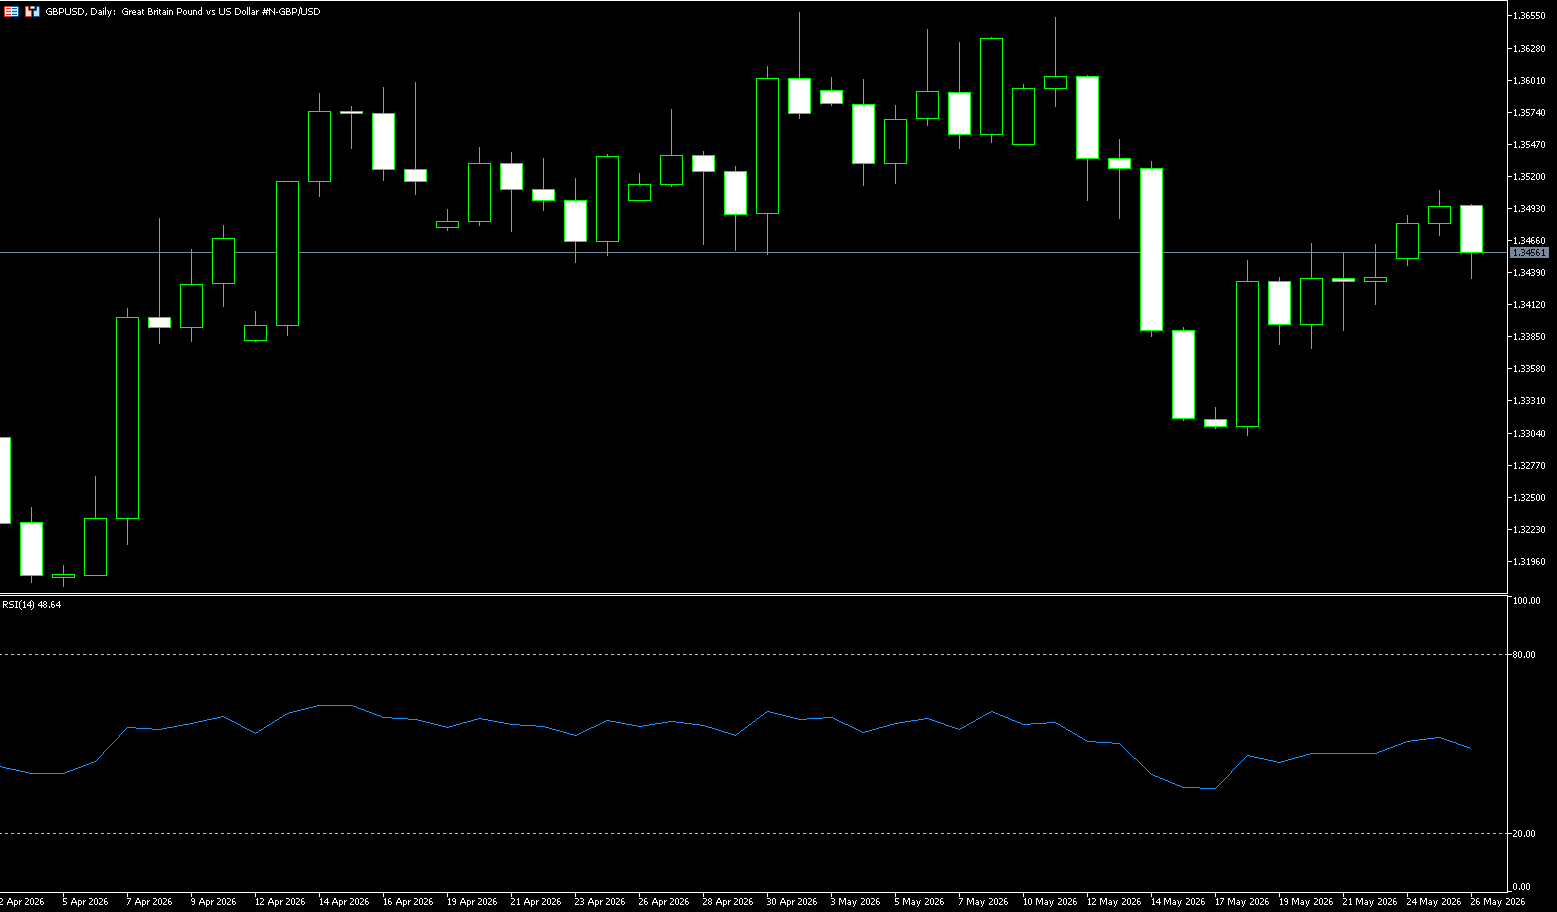
The pound/dollar rose in Asian trading on Monday, nearing 1.3500. The pair strengthened due to increased hopes for a deal between the US and Iran, leading to a significant improvement in market sentiment towards risk assets. S&P 500 futures rose 0.85% to near 7,540 during Asian trading, reflecting strong investor demand for risk-sensitive assets. The dollar index, which tracks the dollar's value against six major currencies, fell 0.3% to near 99.00. However, pound bulls appeared hesitant given the serious leadership challenges facing British Prime Minister Keir Starmer. This, coupled with the dollar's bullish stance, limited the upside potential of GBP/USD. Despite positive news, investors remained skeptical of a US-Iran peace agreement due to significant disagreements over Tehran's nuclear program and the standoff in the Strait of Hormuz. This, along with hawkish expectations from the Federal Reserve, supported the dollar and limited GBP/USD gains.
GBP/USD's rebound from a six-week low near 1.3300 was capped as selling pressure continued to linger above the 1.3450-1.3400 area. Despite later pressure, GBP/USD recorded weekly gains, reversing some of last week's sharp decline. At the start of the week, GBP/USD traded above around 1.3400. The pair extended its rebound, approaching the 50-day simple moving average of 1.3441, suggesting a slightly constructive short-term trend. A broader downtrend line, with breakout points near 1.3551 (May 13 high) and 1.3600 (psychological level), continues to limit the upside of the medium-term structure, while the Relative Strength Index (RSI) (14) is around 48, suggesting neutral momentum after the recent rebound from the lows. Support lies at the May 22 low of 1.3413; a daily close below this level would expose a deeper pullback risk, targeting the May 20 low of 1.3375.
Consider going long on GBP at 1.3436 today, with a stop loss at 1.3425 and targets at 1.3500 and 1.3510.
USD/JPY
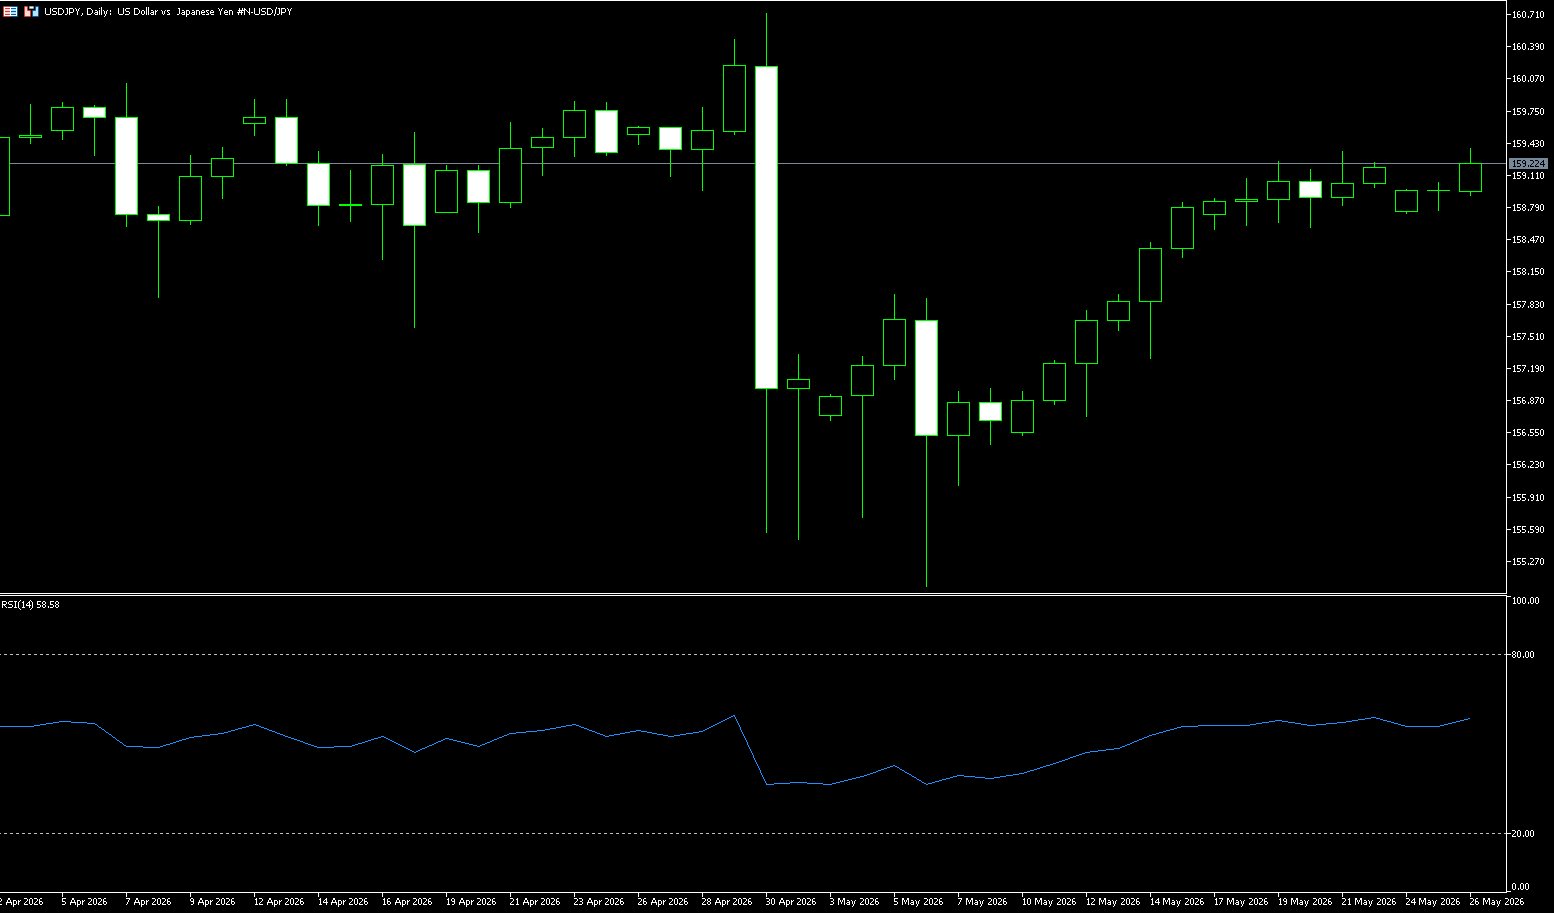
USD/JPY rose slightly in Asian trading on Tuesday, with bulls waiting for a sustained strength and a hold above 159.00 before positioning for further gains. However, the spot price remains near the three-week high reached last Thursday and is supported by multiple factors. Weekend developments fueled hopes for a US-Iran deal to end the nearly three-month war, although optimism was limited by significant disagreements over Tehran's nuclear program and the Strait of Hormuz. Furthermore, Fox News reported that US troops conducted a "self-defense strike" in southern Iran on Monday. This, in turn, helped the safe-haven dollar recover some of the ground it had fallen to a more than one-week low the previous day, providing tailwinds for USD/JPY. Additionally, hawkish expectations from the Federal Reserve, given persistent inflation and economic resilience, were another factor supporting the dollar. On the other hand, the yen was pressured by concerns that the Japanese economy would face significant pressure from continued disruptions to Middle Eastern energy supplies. This provided additional support for USD/JPY and supports the view that the upward trend could continue from the psychological level of 155.00 or the monthly low.
From a 4-hour chart technical perspective, the price briefly broke below the Bollinger Band's middle line and is currently between the middle and lower bands. The Bollinger Bands are narrowing and flattening, indicating declining short-term volatility and a period of directional choice. The upper and middle bands form short-term resistance, while the lower band provides initial support. The MACD indicator shows the DIFF line crossing below the DEA line, forming a death cross, and the MACD histogram continues to expand, indicating that short-term bearish momentum dominates, and the medium-to-long-term rebound structure has not yet fully reversed. In terms of candlestick patterns, after rebounding to 159.35, multiple doji and small bearish candlesticks appeared, showing clear resistance at higher levels and a short-term pullback is likely. Currently, the market is consolidating at higher levels after the rebound, with initial support at 158.10 (the Bollinger Band midline on the daily chart). A decisive break below this level could lead to a further test of the 157.61 area (the 100-day moving average). If the market returns and holds above 159.0, it may retest 159.35 (last week's high) and the psychological level of 160.00.
Today, consider shorting the US dollar at 159.50, with a stop loss at 159.70 and targets at 158.70 and 158.60.
EUR/USD
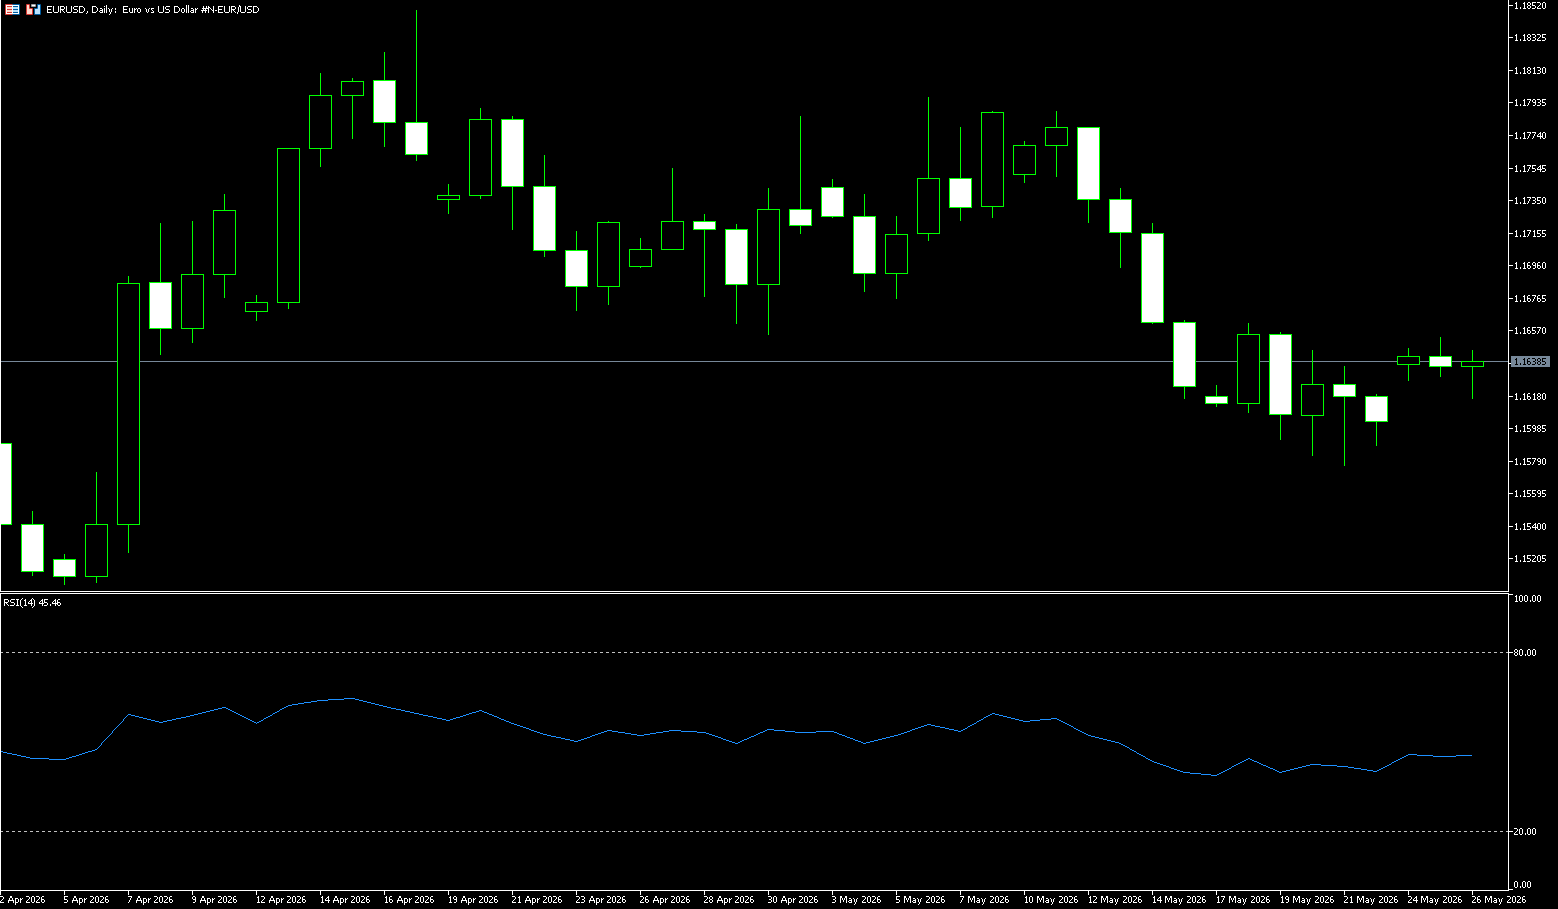
The EUR/USD opened with a bullish gap at the start of the new week, as renewed optimism about a potential US-Iran peace deal weighed on the safe-haven dollar. Spot prices rebounded during the Asian session, near the mid-1.1600 level, with the EUR/USD rising to 1.1645, up 0.37% from the previous trading day. Over the past month, the EUR/USD has fallen 0.65%, but has risen 2.27% over the past 12 months. Historically, the EUR/USD reached its all-time high of 1.87 in July 1973. The euro only began circulating as a currency on January 1, 1999. However, by considering weighted averages of previous currencies, synthetic historical prices can be modeled much earlier. However, caution is still advised regarding the overall situation, and it's best to avoid prematurely betting on a continuation of the modest rebound from the April 7th low of around 1.1575 reached last Thursday.
From a technical perspective, EUR/USD remains above the 23.6% Fibonacci retracement level of the April-May decline. Furthermore, the Relative Strength Index (RSI) is around 45, and the Moving Average Convergence Divergence (MACD) indicator is slightly positive, suggesting improved momentum. This supports the possibility of further appreciation during the session, although hawkish Fed bets may limit the dollar's decline and suppress spot prices. Therefore, any further gains are more likely to encounter immediate resistance near the 1.1660 (last week's high) level, at which point the current bearish technical logic will fail, and a reversal will occur, initially targeting the 1.1700 (psychological level). A break above this level would target the 1.1787 (May 12th high) level. On the downside, near-term support is at the psychological support level of 1.1600, with deeper support at 1.1577 (the lower Bollinger Band) and the 1.1500 level area.
Today, consider going long on the Euro at 1.1620, with a stop-loss at 1.1610 and targets at 1.1660 and 1.1680.
Disclaimer: The information contained herein (1) is proprietary to BCR and/or its content providers; (2) may not be copied or distributed; (3) is not warranted to be accurate, complete or timely; and, (4) does not constitute advice or a recommendation by BCR or its content providers in respect of the investment in financial instruments. Neither BCR or its content providers are responsible for any damages or losses arising from any use of this information. Past performance is no guarantee of future results.
More Coverage





Risk Disclosure:Derivatives are traded over-the-counter on margin, which means they carry a high level of risk and there is a possibility you could lose all of your investment. These products are not suitable for all investors. Please ensure you fully understand the risks and carefully consider your financial situation and trading experience before trading. Seek independent financial advice if necessary before opening an account with BCR.
BCR Co Pty Ltd (Company No. 1975046) is a company incorporated under the laws of the British Virgin Islands, with its registered office at Trident Chambers, Wickham’s Cay 1, Road Town, Tortola, British Virgin Islands, and is licensed and regulated by the British Virgin Islands Financial Services Commission under License No. SIBA/L/19/1122.
Open Bridge Limited (Company No. 16701394) is a company incorporated under the Companies Act 2006 and registered in England and Wales, with its registered address at Kemp House, 160 City Road, London, City Road, London, England, EC1V 2NX. This entity acts solely as a payment processor and does not provide any trading or investment services.


 English
 简体中文
简体中文
 繁體中文
繁體中文
 Bahasa
Melayu
Bahasa
Melayu
 Tiếng
Việt
Tiếng
Việt
 ไทย
ไทย
 日本語
日本語
 한국어
한국어
 ភាសាខ្មែរ
 español