


0
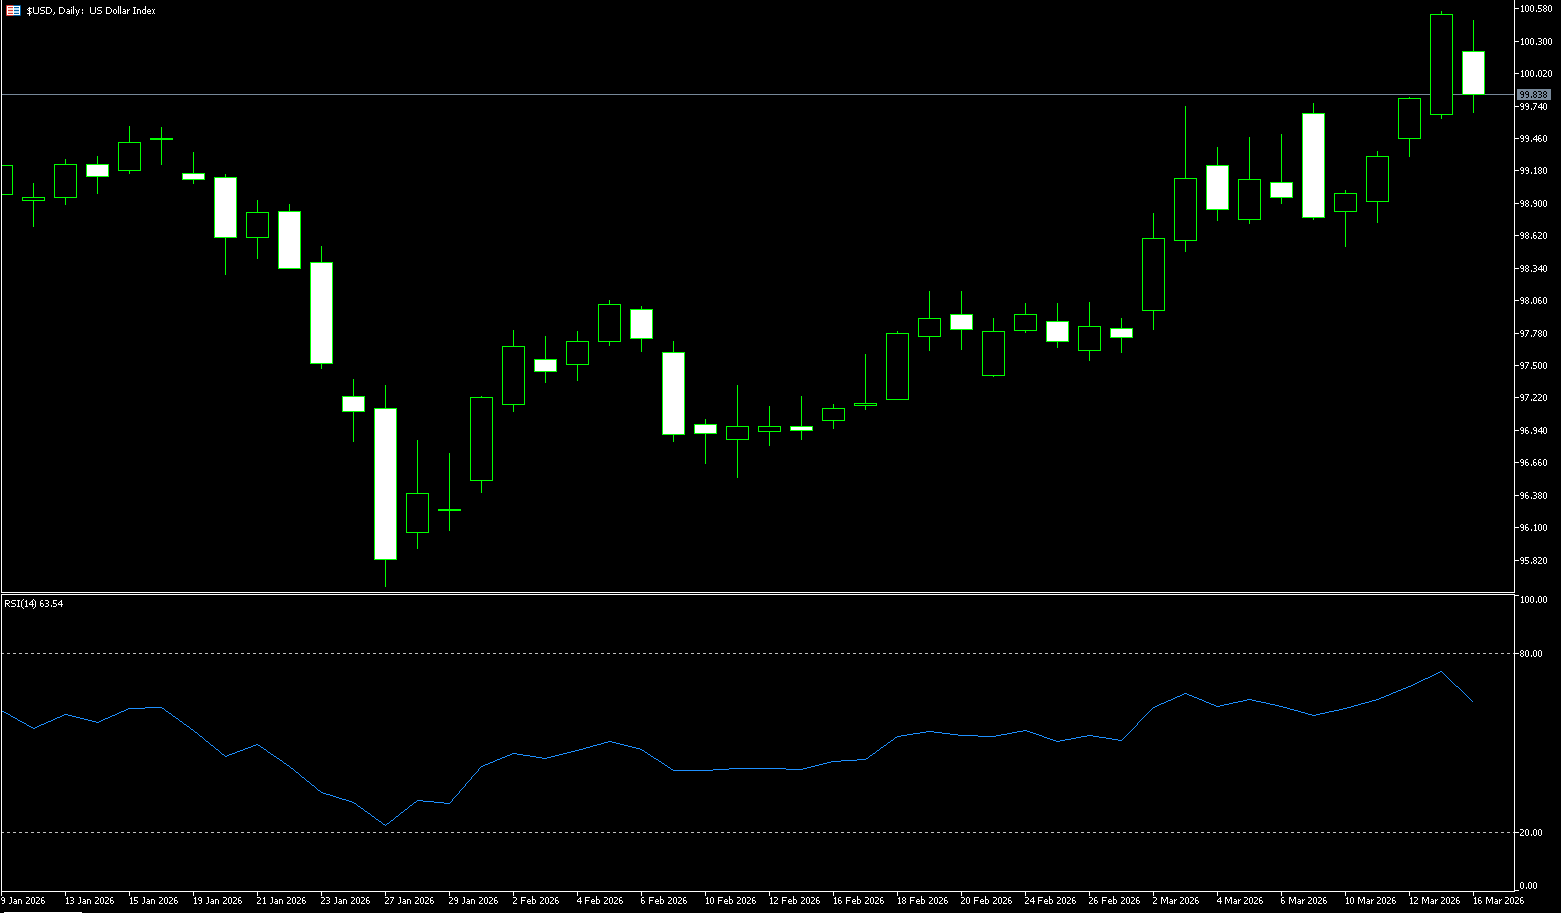
US Dollar Index
The US dollar index held steady below 100 on Tuesday, after being pressured in the previous session, as investors continued to assess the impact of Middle East conflict and volatile oil prices on the economy and inflation. The dollar fell on Monday as several oil tankers safely passed through the Strait of Hormuz, with lower oil prices helping to ease inflation concerns. Treasury Secretary Scott Bessant also stated that the US allowed Iran to continue transporting crude oil through the Strait of Hormuz, and that President Donald Trump had asked other countries to support efforts to protect commercial activities along the waterway. Meanwhile, the market widely expects the Federal Reserve to keep interest rates unchanged on Wednesday as policymakers grapple with uncertainty surrounding the war with Iran. Investors will be closely watching central banks' assessments of the recent surge in energy prices and their impact on inflation and borrowing costs.
From a technical perspective, the dollar briefly touched a high near 100.10 in early trading but then quickly retreated and fell below the 100 level. Nevertheless, the overall decline did not extend further, and the index is currently oscillating within the high range formed over the past few months. From a market structure perspective, this appears more like a consolidation phase after a period of continuous gains than a trend reversal. Technically, the short-term trend of the US dollar index does show some downward pressure. Currently, the overall technical signals for the US dollar index are biased towards "sell." Meanwhile, while the daily and weekly charts remain at relatively high levels, some momentum indicators are showing signs of divergence. For example, the MACD momentum has weakened, and the RSI is gradually declining from its high range, which typically indicates that upward momentum is slowing and the market may be entering a consolidation phase in the short term. Looking at key price levels, the 99.50 to 99.40 area forms short-term support. If this level is effectively broken, the US dollar index may further decline to test the next support area near 98.80. Conversely, if the index regains its footing above 100, it may resume its previous upward momentum and retest the recent high of 100.50.
Today, consider shorting the US Dollar Index at 99.70, with a stop-loss at 99.80 and targets at 99.20 and 99.30.
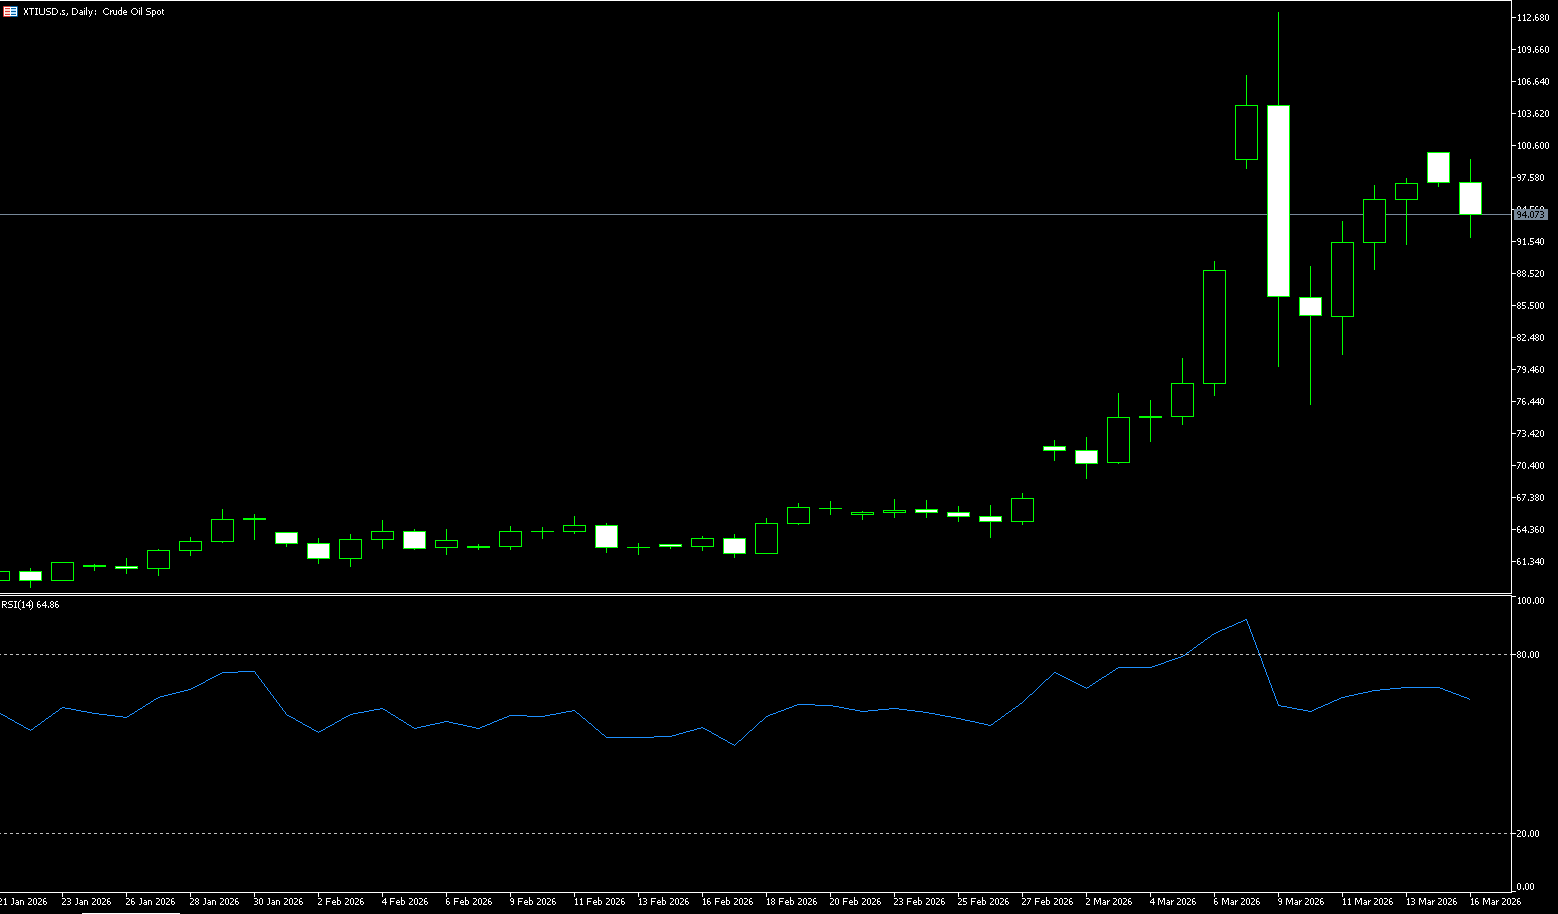
WTI Crude Oil
WTI crude oil traded around $95.00 per barrel. Oil prices fell on Monday as some ships passed through the crucial Strait of Hormuz, temporarily easing extreme market concerns about supply disruptions, while US allies rejected calls for assistance in clearing the strait. WTI crude oil fell more sharply, closing down 5.3% at $93.50 per barrel, mainly due to near-record US crude oil production, the impending release of strategic petroleum reserves, and pre-expiration selling of near-month contracts. Previously, due to escalating geopolitical conflict, both benchmark oil prices had risen nearly 40% since the end of February. Meanwhile, the US and Iran resumed their first known direct communication since the start of the war, with the US Treasury Secretary stating "no objection" to some ships passing through the strait and that measures to ease prices would depend on the duration of the conflict. Furthermore, the International Energy Agency (IEA) indicated it might release more oil reserves as needed to curb oil price increases triggered by the Iran war.
This week, the market saw a significant pullback. As of the latest data on March 17th, WTI crude oil settled around $94 per barrel, a drop of about 5%-6% from its previous high. This decline is not a signal of risk abating, but rather the result of multiple short-term factors: after several weeks of continuous gains, profit-taking pressure from long positions has increased. For crude oil trading, the real-time development of geopolitical events has become a key variable influencing short-term decisions, and the progress of channel repair will directly determine the pace of market risk appetite shifts. Technically, WTI crude oil has broken through the key $90-$95 level. The next major resistance is currently at $99.91 (the high at the beginning of the week) and around $100.00 (a key psychological level), which are the next stage of resistance levels. A break below these levels would revisit the previous high of $113.28. On the downside, watch for $91.90 (Monday's low) and the $90.00 (a psychological level).
Today, consider going long on spot crude oil at 94.80, with a stop-loss at 94.60 and targets at 98.00 and 97.00.
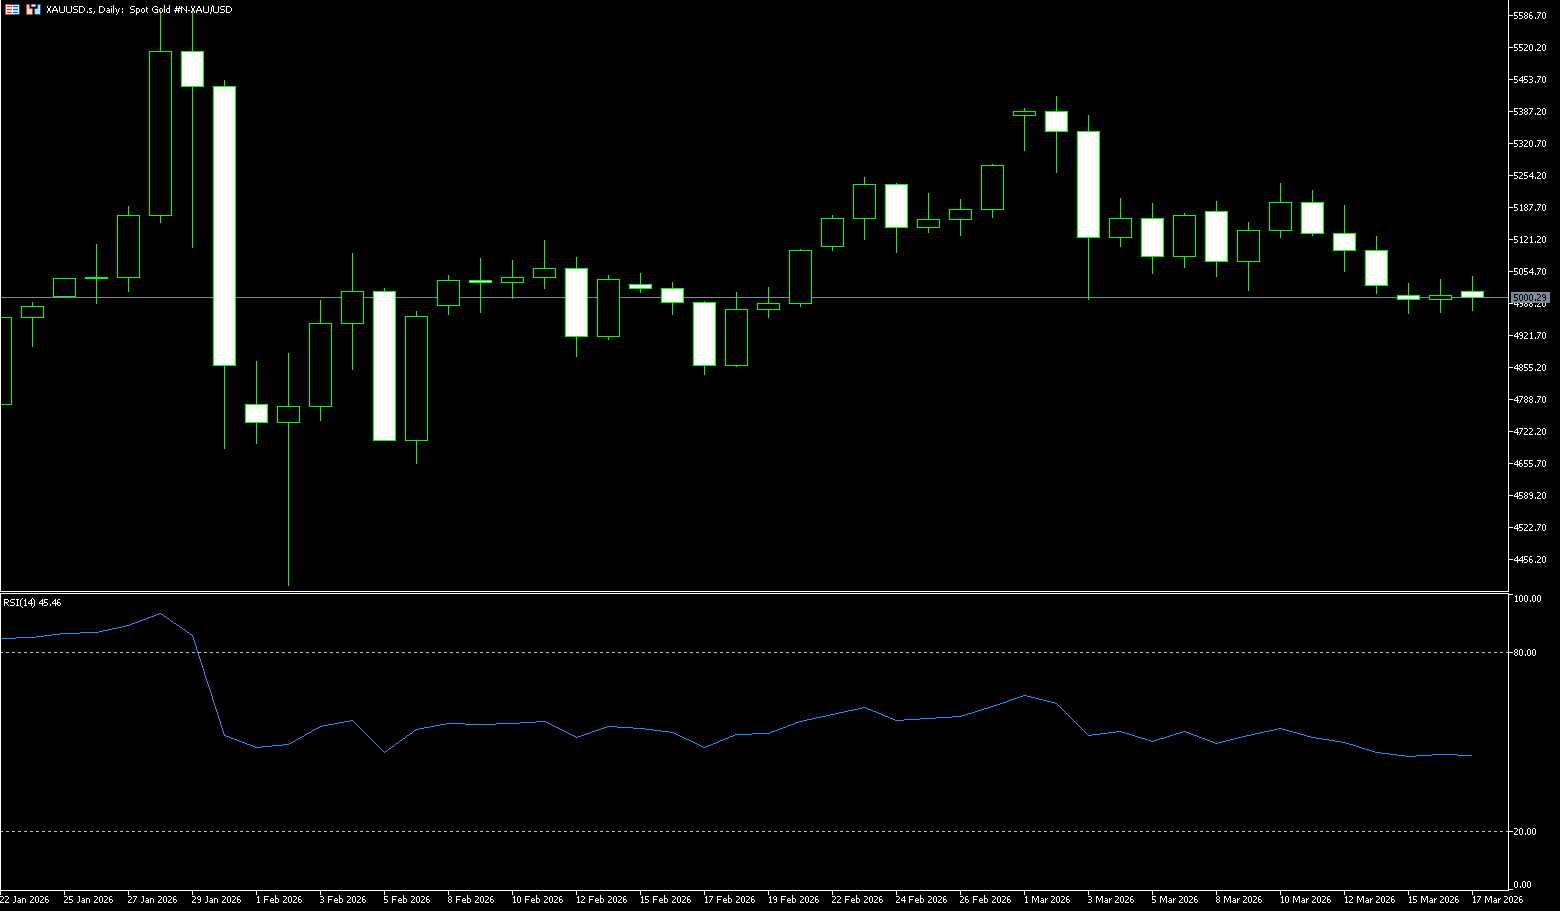
Spot Gold
Gold fluctuated around $5,000 per ounce on Tuesday, but remained near its lowest level in nearly a month as traders continued to assess the impact of the Middle East conflict on inflation and monetary policy prospects. The conflict between the US and Israel and Iran has entered its third week, with Iran escalating its attacks on the region's energy infrastructure, while President Trump warned of a direct attack on Iranian oil facilities on the Strait of Hormuz. The conflict has kept energy prices high, raising concerns that continued increases could further push up inflation and reinforce a hawkish stance by central banks. Markets widely expect the Federal Reserve to keep interest rates unchanged this week, and other major central banks, including the European Central Bank, the Bank of England, and the Bank of Japan, are also expected to maintain their current policy settings. Meanwhile, President Trump reiterated his call for other countries to help secure the Strait of Hormuz, although some countries have declined to participate.
The short-term trend is slightly bullish, with prices stabilizing above the 50-day simple moving average, near 4,965, and comfortably above the 100-day and 200-day simple moving averages. The 20-day simple moving average has flattened out near 5,125 but remains above spot, suggesting a shallow consolidation within a broader uptrend rather than a full reversal. The Relative Strength Index (RSI) is around 47.54, still close to the neutral midline, indicating weakening momentum but no clear shift to sellers. Immediate support is seen at the key support level of $5,040, but a further test of the $4,965 (50-day moving average) should be anticipated, potentially leading to a short-term pullback to the $4,900 psychological level. If gold can effectively break through the $5,100 resistance level, the next target will likely be $5,200.
Today, consider going long on spot gold at 5,000, with a stop loss at 4.990 and targets at 5,040 and 5,050.
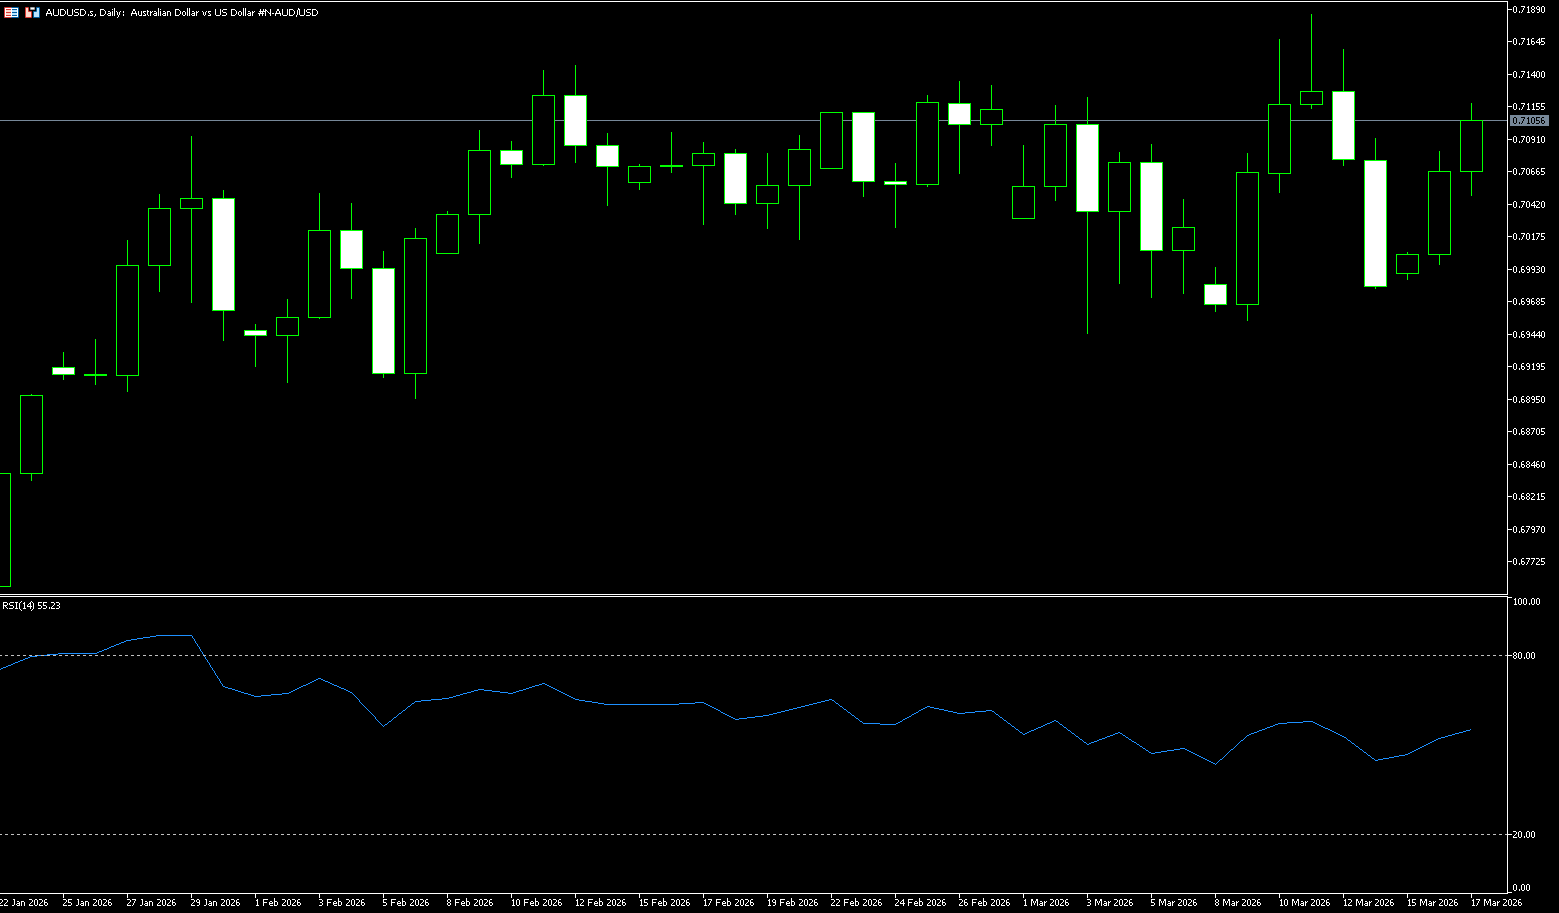
AUD/USD
The Australian dollar rose to US$0.7110 on Tuesday, extending gains from the previous session, as the Reserve Bank of Australia (RBA) raised interest rates for the first time since mid-2023. The central bank raised the cash rate to 4.1%, marking the second consecutive monthly increase and reversing two rate cuts last year. This move underscores the RBA's ongoing struggle to curb persistent inflation, driven by rising energy costs due to escalating tensions in the Middle East. The market also expects another rate hike in May, which could raise the cash rate to 4.35% and completely reverse the 75 basis point rate cuts implemented during last year's six-month easing cycle. Investors will be closely watching RBA Governor Michelle Bullock's post-meeting press conference for clues about the bank's future policy direction. Attention will then turn to Thursday's labor market data, which investors will scrutinize closely following Governor Bullock's recent comments that the market remains tense. The Australian dollar's interest rate hike was in line with expectations, and the market reaction was mild. Following Chairman Bullock's speech, the Australian dollar against the US dollar generally remained range-bound, currently trading around 0.7100, reflecting market acceptance of the Reserve Bank of Australia's (RBA) vigilance regarding inflation risks.
On the daily chart, the short-term bias for the Australian dollar against the US dollar is slightly bullish, as the price remains above the rising 50-day simple moving average at 0.6969 and is consolidating below recent highs. Daily closing prices clustered in the upper half of the Bollinger Bands, and the band has flattened, suggesting continued but weakening upward momentum rather than a sell-off top. The Relative Strength Index (RSI) has retreated from overbought territory above 70 to around 52, indicating that bullish pressure remains, but the upward acceleration has weakened after the surge at the beginning of the month. Immediate support is at 0.7000 (a psychological level), followed by the 50-day simple moving average at 0.6969. On the upside, initial resistance is at 0.7150, then the 0.7200 (a psychological level).
Consider going long on the Australian dollar at 0.7100 today, with a stop loss at 0.7090 and targets at 0.7150 and 0.7160.
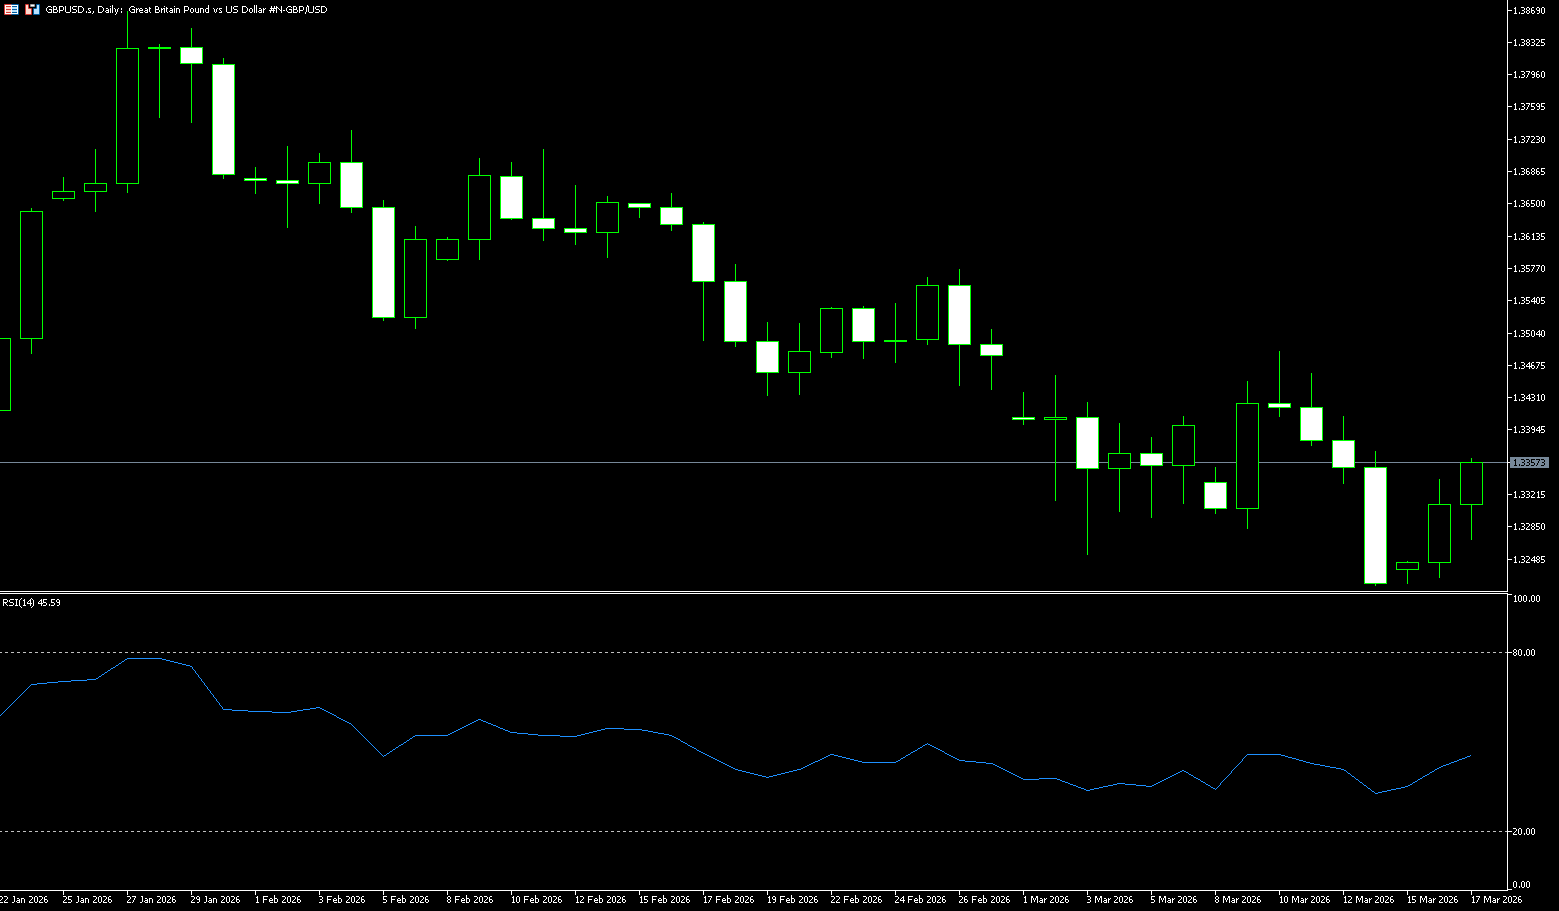
GBP/USD
The pound rose against its major currency counterparts, gaining to near 1.3360 during Tuesday's European trading session. The pound faced selling pressure due to uncertainty surrounding the Bank of England's monetary policy announcement on Thursday. Investors expect the Bank of England to keep interest rates unchanged at 3.75% by a 7-2 majority, as the Middle East conflicts involving the US, Israel, and Iran have fueled rising inflation expectations in the UK and globally. Prior to the Iranian conflict, traders were confident that the Bank of England would cut rates by 25 basis points to 3.5%. Market expectations for a dovish stance from the Bank of England have increased due to deteriorating labor market conditions and signs of easing inflationary pressures. Meanwhile, a slight rebound in the dollar after Monday's adjustment also weakened the pound/dollar pair. Looking ahead, the main driver for the dollar will be the Federal Reserve's monetary policy announcement on Wednesday. Investors expect the Fed to keep interest rates unchanged in the current 3.50%-3.75% range.
This week's sharp rally in GBP/USD from 1.3226 to 1.3340 appears more like a short-term pullback than a trend reversal. The pair is expected to fluctuate between 1.3250 and 1.3360. The outlook remains bearish over the 1-3 week timeframe, with 1.3180 being a key level, and a weekly close below 1.3300 could open the way for 1.2945/1.3010 in the coming months. Furthermore, the 14-day Relative Strength Index (RSI) hovering below 40 confirms continued downward pressure rather than oversold conditions, focusing on the recent series of intraday lows. GBP/USD may test lower levels, looking for key support at the three-month low of 1.3253, which was reached on December 3rd. Further declines would put downward pressure on the pair, keeping it near the lower boundary of the descending channel. On the upside, immediate resistance lies at the 14-day simple moving average at 1.3370. A further break above this level would establish a bullish bias and support the GBP/USD pair testing the 20-day simple moving average at 1.3415.
Consider going long GBP at 1.3350 today, with a stop-loss at 1.3340 and targets at 1.3410 and 1.3420.
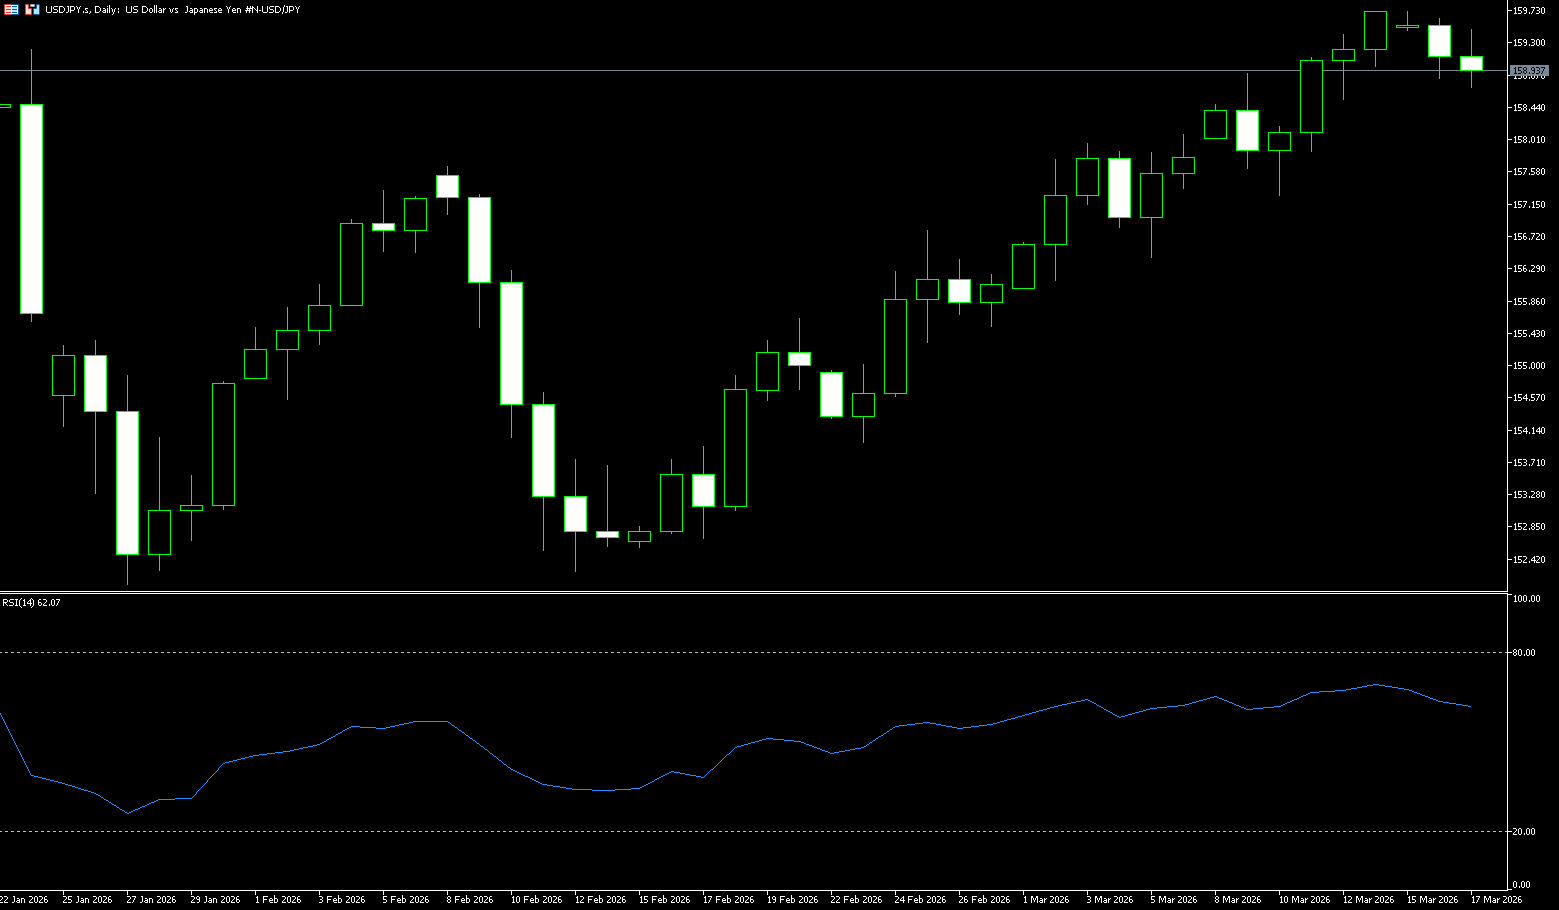
USD/JPY
The yen gave back gains from the previous session before falling to near 159.00 per dollar on Tuesday, as verbal intervention by authorities has so far failed to halt the currency's decline. Finance Minister Satsumi Katayama stated that recent currency volatility does not reflect fundamentals and reiterated warnings that authorities might take action to defend the yen. She added that they are prepared to respond at any time, given the impact of rising exchange rates and oil prices on daily life. Meanwhile, Bank of Japan Governor Kazuo Ueda stated that underlying inflation is gradually moving towards the 2% target. Amid heightened uncertainty about the domestic economic impact of the war with Iran, markets widely expect the central bank to keep interest rates unchanged this week. Japan has so far rejected US President Donald Trump's call to send warships to escort oil tankers through the Strait of Hormuz.
From a technical perspective, the short-term bias is slightly bullish, as USD/JPY is firmly above the rising 20-day simple moving average at 157.19 on the daily chart, indicating that buyers remain in control despite recent hesitation. Furthermore, the MACD has slightly turned positive after recovering from negative territory, suggesting improving upward momentum. Nevertheless, the Relative Strength Index (RSI) is near 64, still above the neutral line, which reinforces the mild upward tone rather than a strong trend. Therefore, any further gains are more likely to face some resistance near the 159.75 area (last Friday's high), followed by 160.00, where psychological selling could limit gains. A clear close above the latter would strengthen the bullish outlook and pave the way for a retest of higher highs towards 160.00-161.50 in the coming trading sessions. On the downside, initial support lies at the 14-day simple moving average at 157.98 and the psychological level of 157.00. A break below these levels would expose the next downside level, approaching the 20-day simple moving average at 157.19 and the 157.00 psychological level area.
Consider shorting the US dollar today at 159.15, with a stop loss at 159.34 and targets at 158.30 and 158.40.
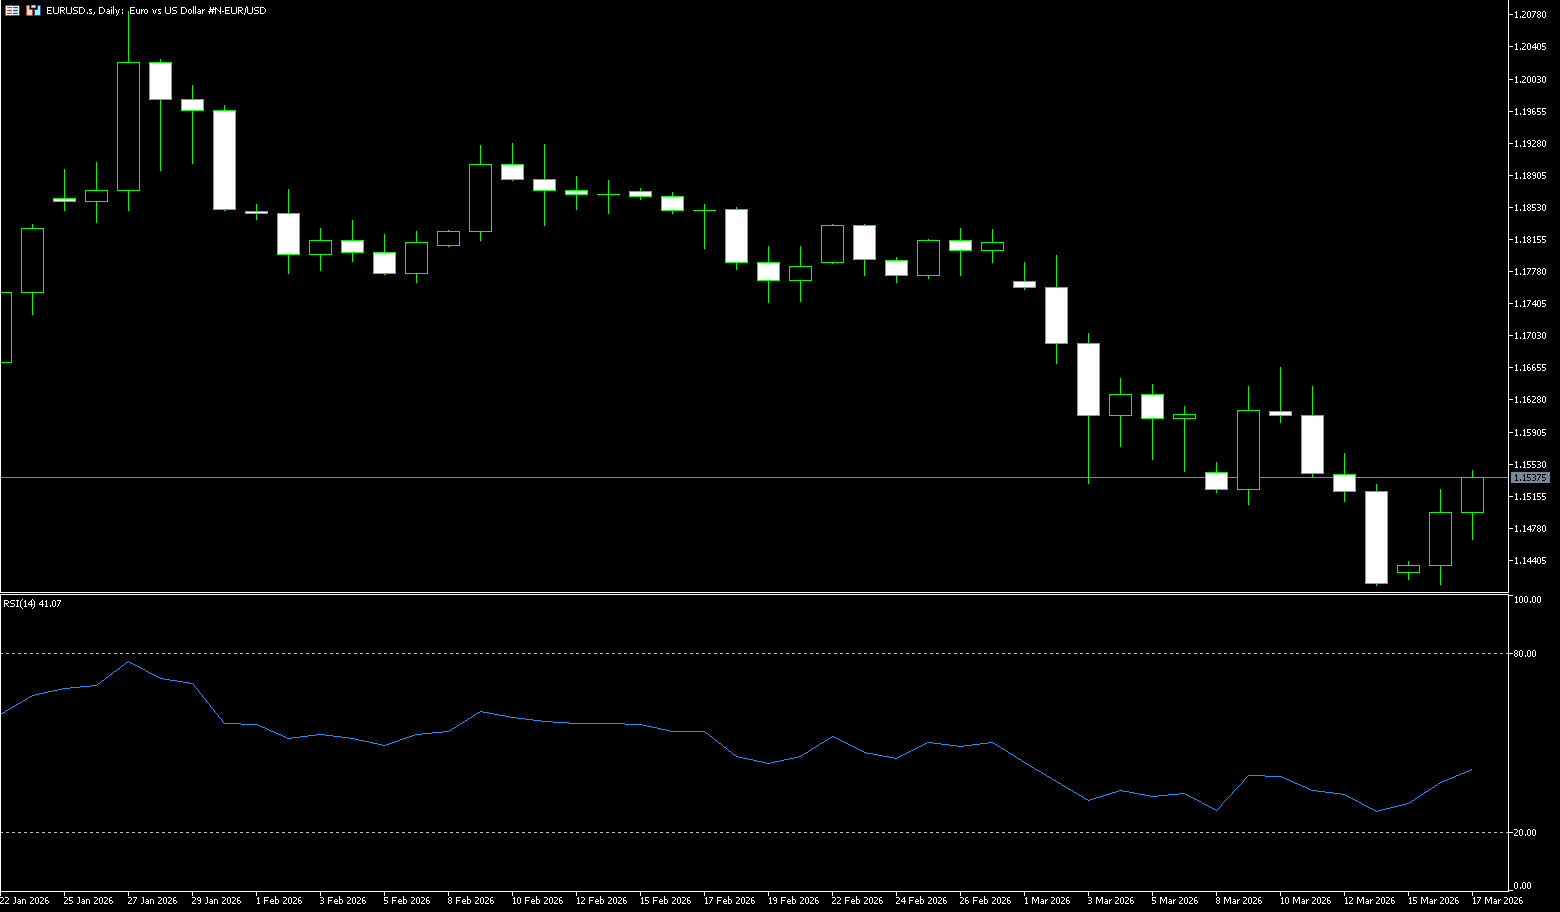
EUR/USD
The European Central Bank (ECB) is expected to keep interest rates unchanged until the end of 2026 at its meeting this week. Vanguard economist Rodriguez stated that the magnitude and duration of the Middle East oil price shock will determine a policy shift, eliminating previous inclinations towards rate cuts. LSEG data shows the market is pricing in a 44 basis point rate hike this year, with upside risks to inflation dominating the outlook. The Middle East geopolitical conflict has led to a sharp rise in oil prices, becoming the biggest uncertainty factor in the current Eurozone inflation outlook. The magnitude and duration of the oil price surge will directly determine whether the ECB is forced to shift from "wait-and-see" to "re-tightening." If the shock is short-lived, inflation may only see a temporary rise, and the ECB can maintain its data-dependent approach. However, if high energy costs transmit to core inflation, policymakers may be forced to raise interest rates in 2026 to anchor expectations. The ECB has recently emphasized its "high concern" about supply-side risks while reiterating its dual mandate (price stability and economic support), but the risk of inflation exceeding the 2% target has significantly cooled expectations for further easing.
The short-term bias is slightly bearish, as EUR/USD is holding below the 10-day (1.1560) and 20-day (1.1662) simple moving averages on the daily chart, both of which slope downwards, reinforcing the downtrend. The Relative Strength Index (RSI) hovers around 36.20, indicating weak momentum, consistent with a corrective downtrend rather than an oversold sell-off. Immediate resistance is at 1.1560, within the 1.1550-1.1565 area, which coincides with the 50-period simple moving average and the lower Bollinger Band. Next is the 20-day simple moving average at 1.1662. On the downside, initial support is at 1.1450, protecting the recent lows; a significant break below this level would expose the area below 1.1414 (the March 16 low), consistent with the bearish bias suggested by the broader moving average configuration.
Consider going long on the Euro today at 1.1530, with a stop loss at 1.1520 and targets at 1.1590 and 1.1600.
Disclaimer: The information contained herein (1) is proprietary to BCR and/or its content providers; (2) may not be copied or distributed; (3) is not warranted to be accurate, complete or timely; and, (4) does not constitute advice or a recommendation by BCR or its content providers in respect of the investment in financial instruments. Neither BCR or its content providers are responsible for any damages or losses arising from any use of this information. Past performance is no guarantee of future results.
More Coverage


Risk Disclosure:Derivatives are traded over-the-counter on margin, which means they carry a high level of risk and there is a possibility you could lose all of your investment. These products are not suitable for all investors. Please ensure you fully understand the risks and carefully consider your financial situation and trading experience before trading. Seek independent financial advice if necessary before opening an account with BCR.
BCR Co Pty Ltd (Company No. 1975046) is a company incorporated under the laws of the British Virgin Islands, with its registered office at Trident Chambers, Wickham’s Cay 1, Road Town, Tortola, British Virgin Islands, and is licensed and regulated by the British Virgin Islands Financial Services Commission under License No. SIBA/L/19/1122.
Open Bridge Limited (Company No. 16701394) is a company incorporated under the Companies Act 2006 and registered in England and Wales, with its registered address at Kemp House, 160 City Road, London, City Road, London, England, EC1V 2NX. This entity acts solely as a payment processor and does not provide any trading or investment services.

 English
 简体中文
简体中文
 繁體中文
繁體中文
 Bahasa
Melayu
Bahasa
Melayu
 Tiếng
Việt
Tiếng
Việt
 ไทย
ไทย
 日本語
日本語
 한국어
한국어
 ភាសាខ្មែរ
 español
