


0
Currency & Commodity Analysis:
US Dollar Index
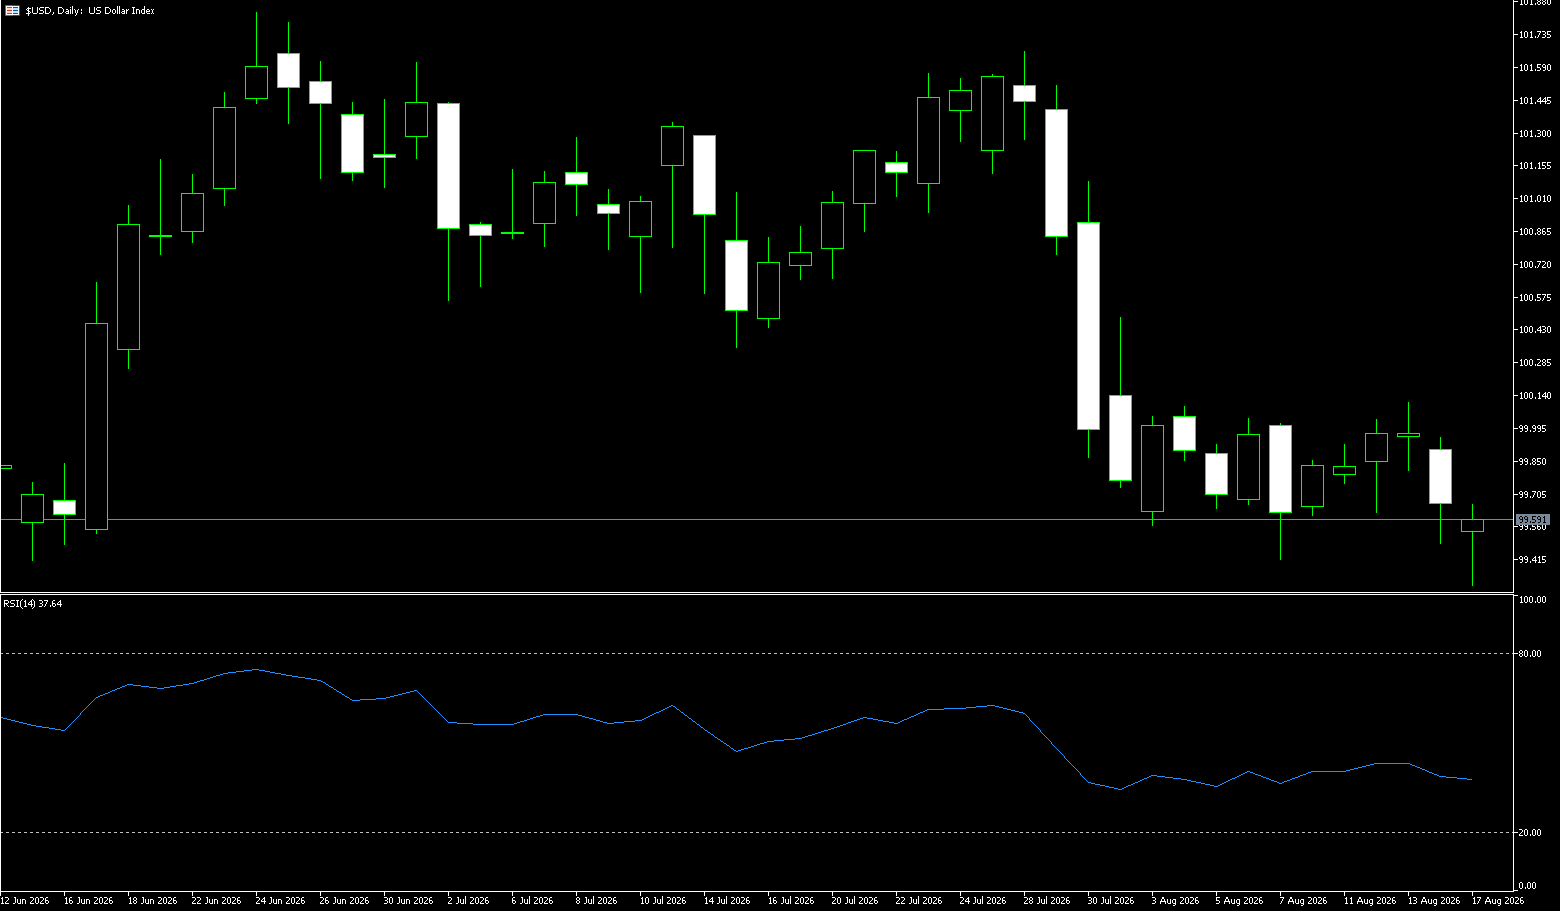
The US dollar index fell to around 99.56 on Monday, marking its third consecutive day of decline, as cooling US economic data prompted traders to lower their expectations for an imminent Federal Reserve rate hike. Data released last week indicated moderate US inflation, while consumer confidence and retail sales were weak. The market currently expects a 67% probability that the Fed will keep interest rates unchanged in September, up from less than 50% a month ago. Investors are now awaiting the latest minutes from the Federal Open Market Committee (FOMC) meeting and Fed Chairman Kevin Warsh's speech at the Jackson Hole symposium for further guidance. Traders will also be watching the New York State Manufacturing Index and the National Association of Home Builders' Housing Market Index, released later today. The US dollar weakened broadly, falling the most against the Australian dollar, New Zealand dollar, and British pound.
On the daily chart, the US dollar index spot remains below a dense band of moving averages and volatility resistance. The 100-day simple moving average at 99.74 and the Bollinger Bands midline at 100.33 are limiting upside, making the short-term bias still bearish. The low 14-day Relative Strength Index (RSI) reading of around 37 further reinforces the weak tone, indicating that downward pressure will persist as long as prices remain capped below these resistance levels. On the upside, initial resistance is at 99.75 near the 100-day SMA, followed by the psychological level of 100.00; if short covering drives a rebound, the upper Bollinger Bands midline near 100.33 will provide further resistance. On the downside, the first significant support level is 99.00 (a psychological level). If sellers further pressure the index, volatility support may slow the decline to 98.75 (the low of May 29th).
Consider shorting the US Dollar Index at 99.66 today, with a stop loss at 99.75 and targets at 99.30 and 99.20.
WTI Spot Crude Oil
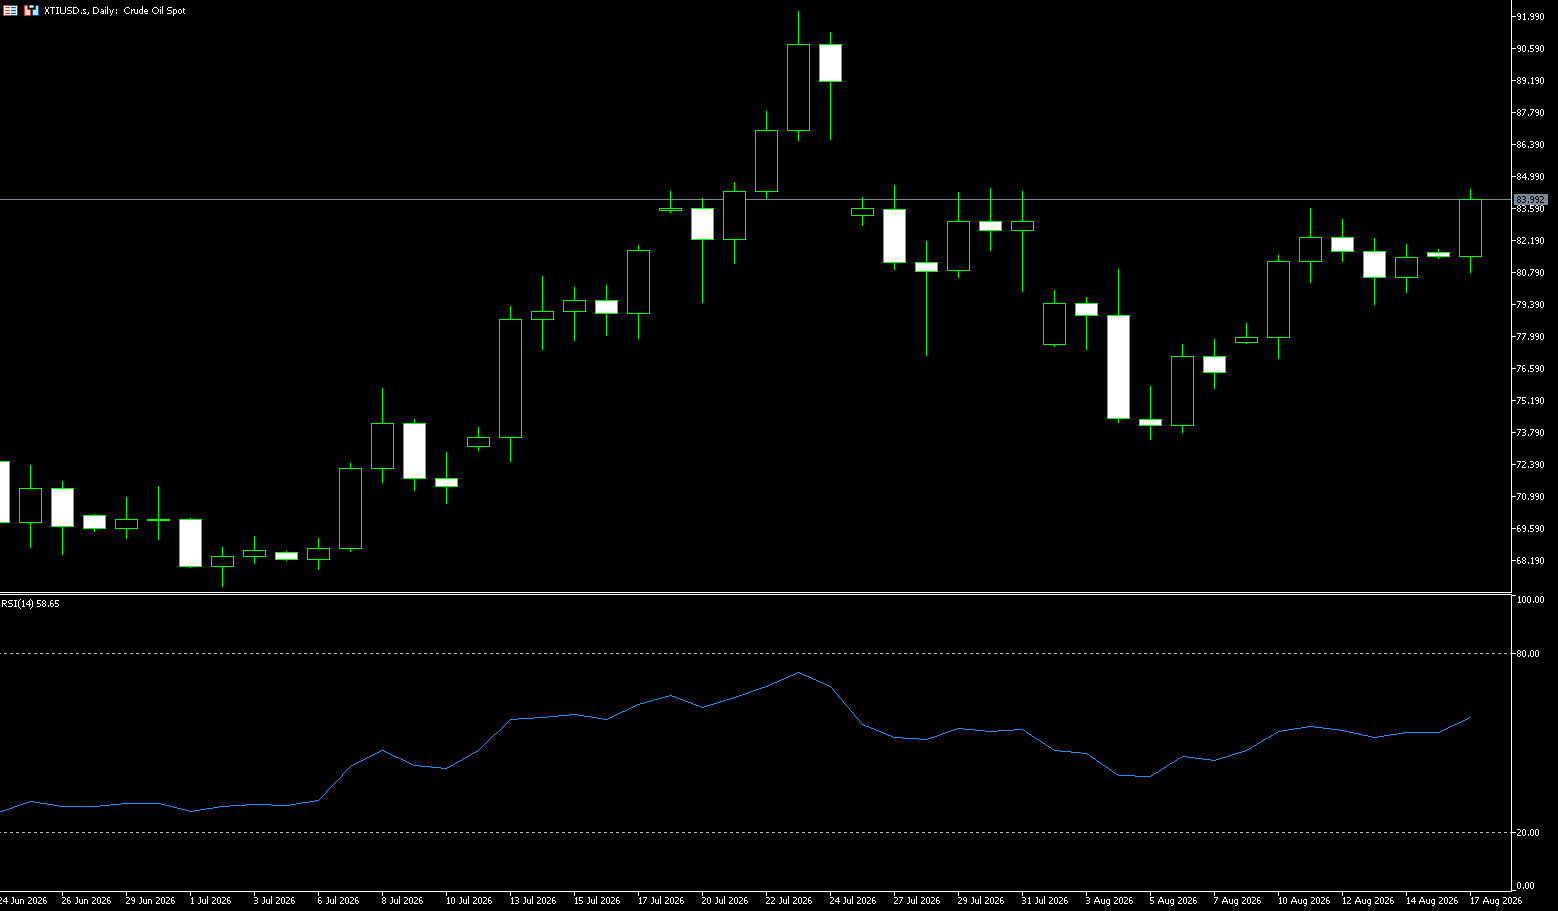
U.S. crude oil traded around $84 a barrel on Monday as traders continued to assess the balance between geopolitical tensions and signs that more oil was passing through the Strait of Hormuz than initially expected. Gulf oil producers appear to be maintaining significant shipments from the Persian Gulf despite the ongoing conflict, helping to alleviate concerns about short-term supply shocks. Meanwhile, diplomatic efforts between Iran and the United States remain stalled. President Trump reportedly threatened military action if Oman interfered with a U.S. blockade of Iranian ships, although oil prices showed little reaction to the statement. Meanwhile, Iran and Oman appear to be making progress in regulating traffic in the Strait of Hormuz, but the United States is not involved in those discussions. Washington is unlikely to support any arrangement that does not guarantee unrestricted passage in this strategic shipping lane.
Looking ahead to the market outlook, the key variables still lie in whether a breakthrough can be achieved in US-Iran negotiations, whether Strait shipping can return to normal, and the actual strength of subsequent US sanctions. If the blockade becomes prolonged or attacks further escalate, the risk of supply disruptions may continue to support high oil prices; conversely, if signs of weak demand continue to accumulate, or expectations of a global economic slowdown intensify, it may suppress high oil prices. Technical aspect: Oil prices fluctuate widely; Weekly pattern: K-line with shadow shock, closing back to the mid-week low area, the high point during the week gradually moved downwards, and the upward momentum significantly weakened. It fell back to $80.50 {last week's low}; and continued to rise after regional support at $80.00 {market psychological mark}. It currently exceeds the 5-day line and is preparing to challenge the daily K-line of the double top. If it continues to hold the 5-day line, it is likely to break through the recent double top pattern. The pressure level is $85.00 {integer mark} to form the first pressure zone, followed by $86.37 {100-day moving average}. The support level is at $80.50 {last week's low}; and $80.00 {market psychological barrier} area; the next support can be focused on $76.18 {200-day moving average}.
Today you can consider going long crude oil at 83.90, stop loss: 83.75, target: 85.00; 86.00
Spot Gold
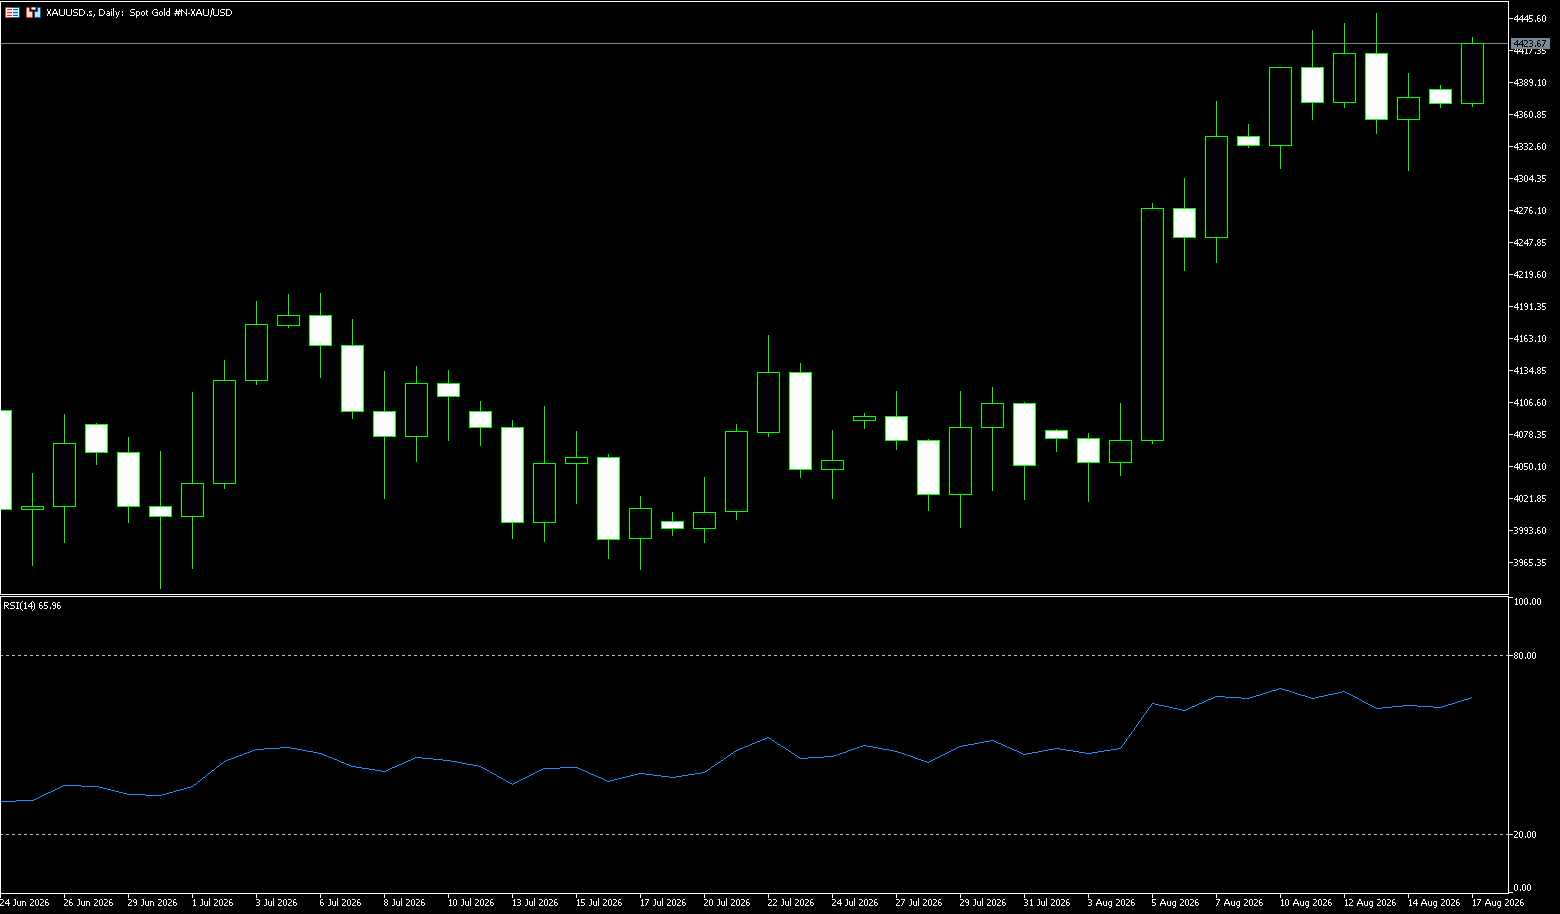
Gold rose to $4,415 an ounce on Monday, extending gains from the previous session as weak U.S. economic data reduced expectations that the Federal Reserve will soon raise interest rates. Data released last week showed U.S. inflation was tame, while consumer confidence and retail sales weakened. Markets now see a roughly one-in-three chance of the Fed raising interest rates in September, down from nearly 50% before the data was released. Investors are now awaiting the minutes of the Federal Open Market Committee's latest meeting and Fed Chairman Kevin Warsh's speech at the Jackson Hole symposium for further guidance. Meanwhile, tensions remain high in the Middle East as Israel launched a new round of airstrikes against Lebanon over the weekend and President Donald Trump prepares new economic sanctions aimed at forcing Iran to capitulate. However, Middle Eastern producers are still secretly shipping millions of barrels of crude through the Strait of Hormuz, keeping oil prices stable and easing concerns about inflation risks.
The core catalysts for the market outlook are concentrated on U.S. employment and inflation data at the end of August and the Federal Reserve's Jackson Hole speech, which will determine the pace of gold's new round of market starts. As long as the core logic remains unchanged, gold's mid- to long-term bull market pattern is stable, and the mid- to long-term target of $5,000 per ounce still has ample room for realization. Looking at the daily chart, gold quickly recovered from the low of around 3,942 on June 30, and once touched around 4,450. After the two-month high was formed, the price retreated. The gold price had clearly deviated from the 50-day moving average of 4,148 and tested 4,500 {integer mark}, and then the fluctuations began to converge. In terms of MACD, DIFF is about 68.84 and DEA is about 34.81. Both continue to run above the zero axis, indicating that the previously formed mid-term repair structure has not been destroyed; reflecting that short-term momentum and price increases are being rematched. On the upside, attention can be paid to last week's high of $4,450 and the $4,500 {round number mark} area. Below, pay attention to $4,377 {Monday's opening price}, and if it breaks, look at $4,300 {integer mark; and the 80-day moving average}.
Today you can consider going long gold at 4,410, stop loss at 4,405; target: 4,450; 4,460
AUD/USD
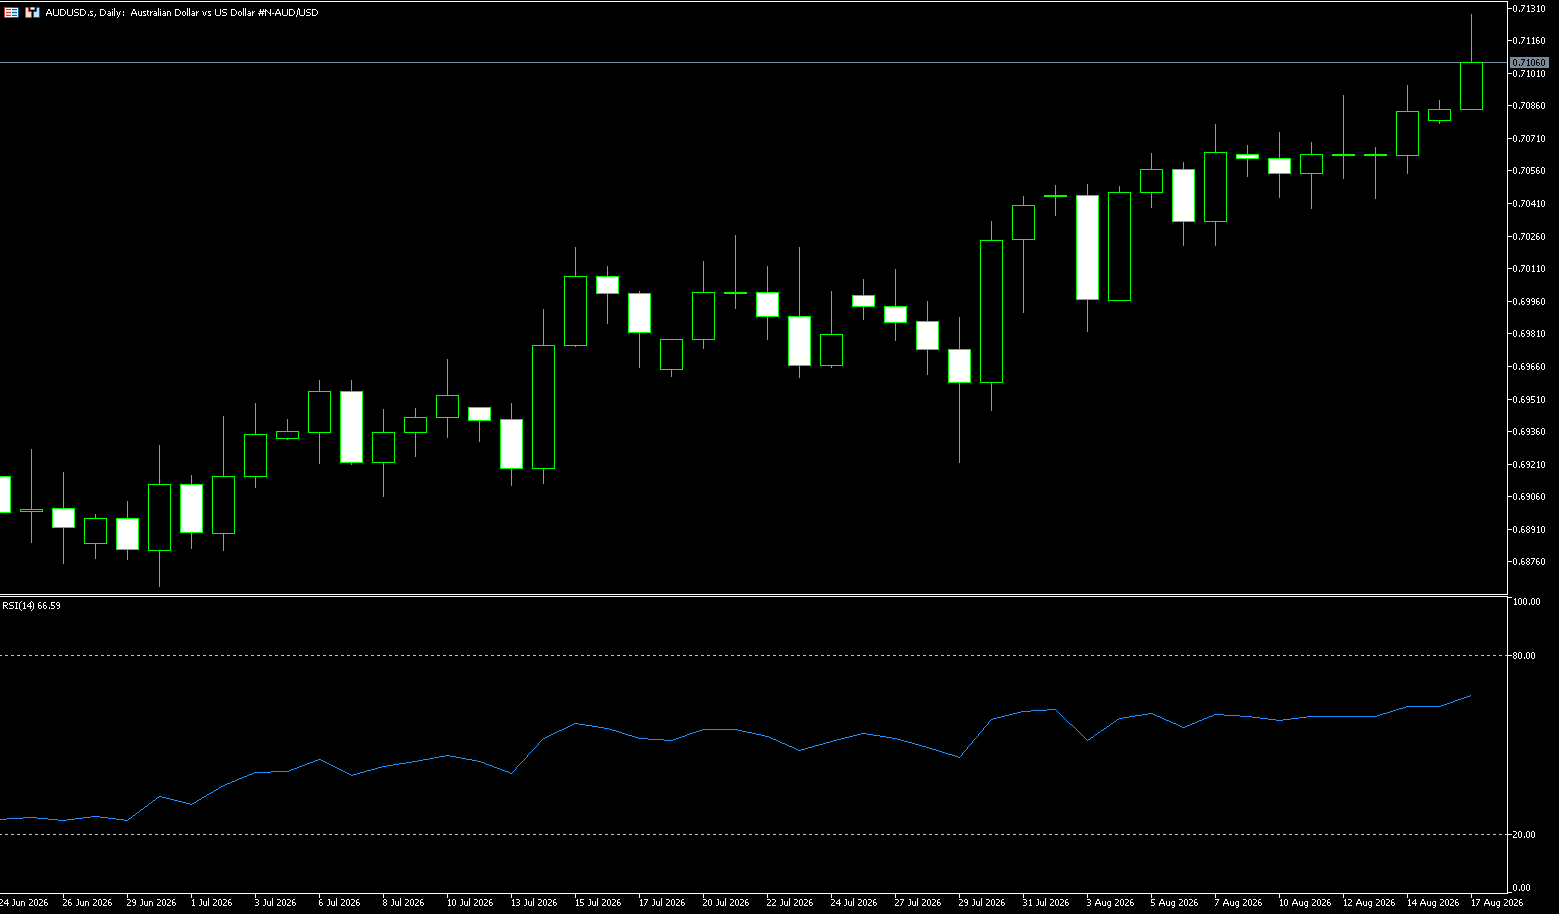
On Monday (August 17th) in early Asian trading, the Australian dollar rose slightly against the US dollar, trading around 0.7090. Unexpectedly weak US July retail sales data, declining 0.6% month-on-month, far below market expectations of a 0.1% increase, further weakened market bets on a September rate hike by the Federal Reserve—putting pressure on the US dollar and providing support for the Australian dollar. Meanwhile, Reserve Bank of Australia Assistant Governor Kent stated last week that tightening policies are working as designed, while Governor Bullock clearly stated that he would "not hesitate to act if necessary," maintaining a hawkish stance. The RBA's latest policy communication "maintained a clearly firm tone," noting that "the statement was hawkish, and Chairman Bullock announced that the RBA would not hesitate to act if necessary." This reinforces the signal that the RBA is prepared to further tighten policy if price pressures fail to ease as expected. The RBA's hawkish stance contrasts with the cooling of expectations for a Fed rate hike, providing support for the Australian dollar from the perspective of policy divergence.
In summary, the Australian dollar benefits in the short term from the cooling of Fed rate hike expectations due to weak US economic data, with a weaker US dollar being the main driver. The RBA's hawkish policy stance and potentially better-than-expected Chinese economic data may provide additional support for the Australian dollar. However, three factors limit the upside potential of the Australian dollar: firstly, the continued uncertainty in the Middle East provides safe-haven buying for the US dollar; secondly, market expectations for a Fed rate hike at the end of the year have not completely disappeared; and thirdly, weaker-than-expected Chinese data could put downward pressure on the Australian dollar. As long as the Australian dollar remains above the psychological level of 0.7000 against the US dollar, a neutral-to-bullish stance should be maintained in the spot market. However, if it continues to fail to hold above 0.7000, the spot market will face the risk of a pullback. A strong break above 0.7100 would indicate that buyers are more confident that the current upward trend is sustainable. In this scenario, the high of 0.7149 (June 4th) would be a minor target, followed by the next important medium-term target of 0.7200 (the psychological level). On the downside, the 70-day moving average at 0.7039 provides immediate support, followed by the psychological level of 0.7000.
Consider going long on the Australian dollar at 0.7100 today, with a stop loss at 0.7090 and targets at 0.7150 and 0.7140.
GBP/USD
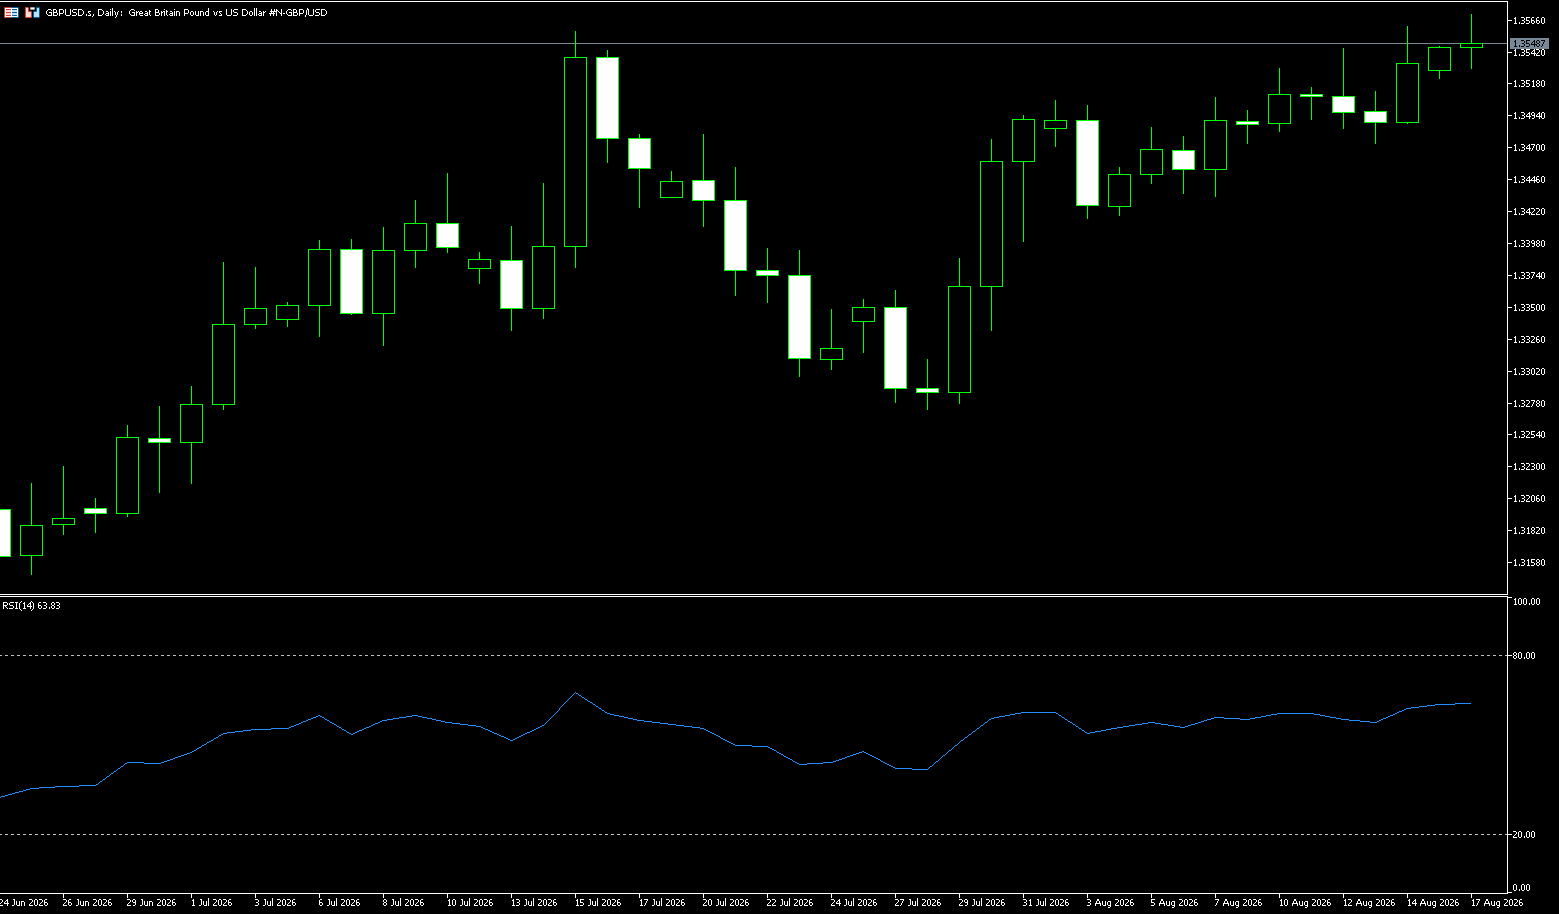
GBP/USD attracted some bargain hunting at the start of the new week, rising above the mid-range of 1.3550 during the Asian session, nearing the more than three-month high reached last Friday. Furthermore, the prevailing dollar selling bias favors bullish traders and suggests that the path of least resistance for spot prices remains upward. The pound was supported by last week's optimistic UK GDP report. In the second quarter, UK economic growth slowed to 0.4% from 0.6%. Nevertheless, these figures support the case for at least one more rate hike by the Bank of England in 2026 and validate the near-term positive outlook for GBP/USD. GBP/USD was the best-performing major currency through August, rising back above 1.3500. The UK economy has shown greater resilience than expected in the face of negative energy price shocks triggered by the US-Iran conflict, further reinforcing the constructive backdrop for the pound. In addition, Wednesday's FOMC meeting minutes should provide new momentum for GBP/USD and inject volatility in the latter half of the week.
On the daily chart, GBP/USD remains above the Bollinger Plus central axis of 1.3434 and the 100-day moving average of 1.3417. Together, they strengthen the short-term bullish constructive tone, while the exchange rate at 1.3593 is approaching the Bollinger Plus track resistance. The Relative Strength Index (14) is around 64, indicating positive momentum, but has not yet given an overbought signal, meaning a pullback may attract buying while the broader uptrend remains intact. On the downside, recent support is found at 1.3500 {market psychological mark}, followed by structural support from the Bollinger axis at 1.3434 and the 100-day moving average at 1.3417. On the upside, the support rail of 1.3593 is the next resistance level worthy of attention. If it can continue to break through, it will open up space for further rises to 1.3658 {high on May 1}.
You can consider going long GBP at 1.3530 today, stop loss: 1.3520; target: 1.3570; 1.3580
USD/JPY
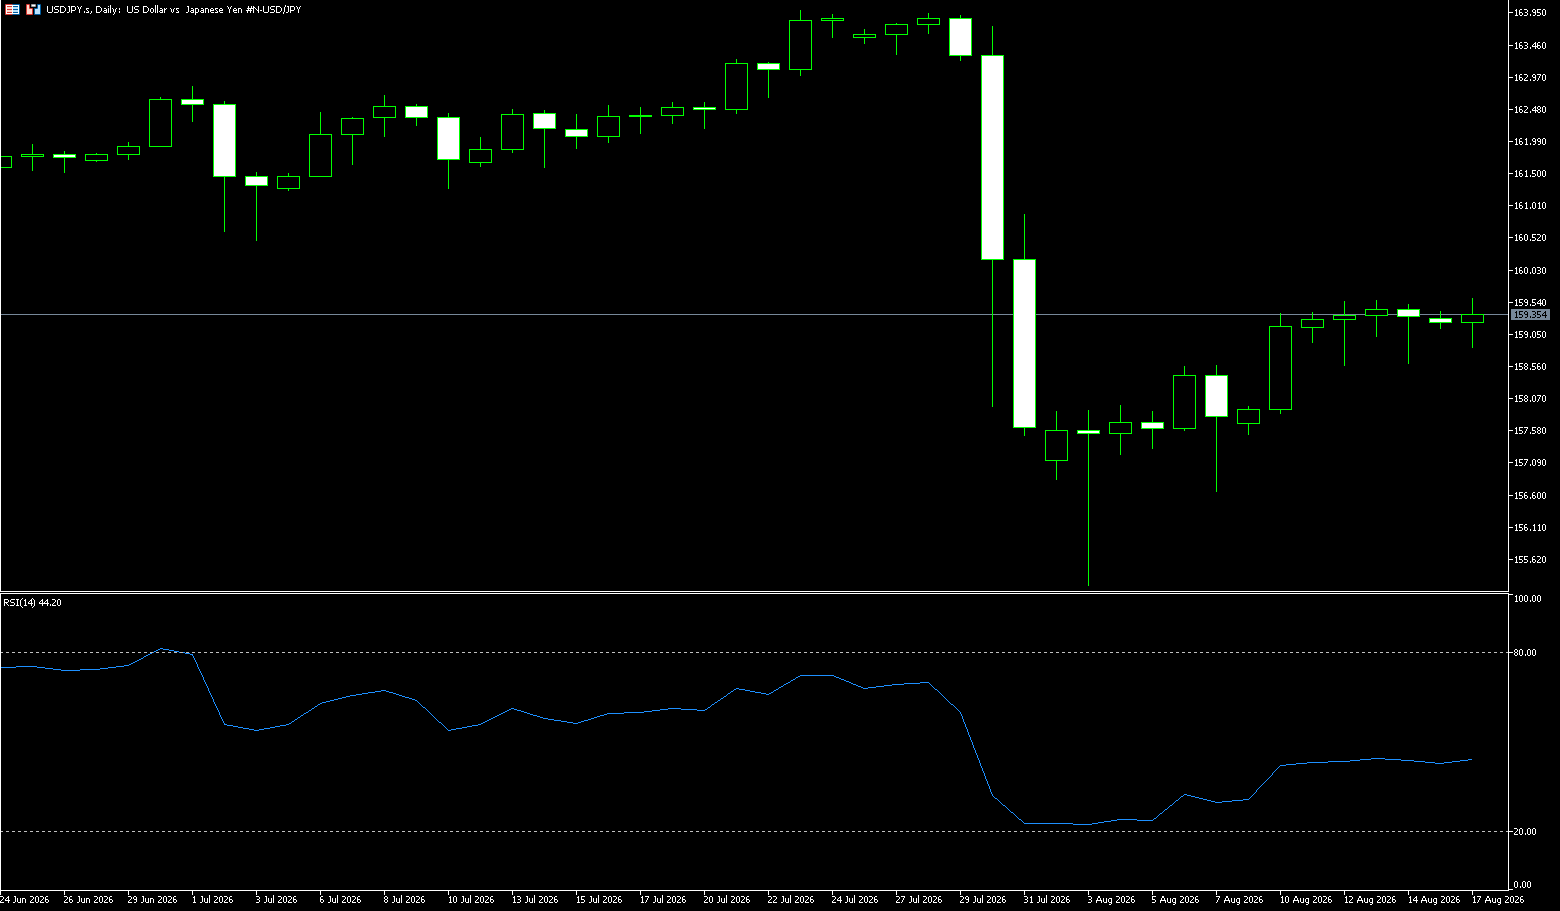
During the Asian session on Monday, USD/JPY lost momentum for the second consecutive trading day, trading around 159.30. The pair traded lower as the yen remained strong following Japan's preliminary second-quarter gross domestic product (GDP) data. Japan's economy grew by 0.3% quarter-on-quarter in the second quarter of 2026, after growing by 0.5% in the first quarter and lower than market expectations of 0.5%. On an annualized basis, Japan's GDP grew by 1.1%, below expectations of 2.0% and the 1.8% growth in the previous quarter. Such a significantly lower-than-expected GDP figure complicates the Bank of Japan's path to further normalizing policy, as the central bank has been relying on stable domestic demand to justify further interest rate hikes after moving away from ultra-loose policies. The yen's recent strength is easing some pressure on policymakers, and the currency's "modest gains" are "likely to make key Treasury officials feel quite reassured, given continued investor concerns about the yen's downward trajectory."
From a technical perspective, USD/JPY rebounded strongly on August 3 from the 155.25-155.20 area, which was the lowest level since early May, but stalled near the 50% Fibonacci retracement level of the intervention-induced pullback from forty-year highs. Meanwhile, momentum indicators suggest that upside momentum is fading as USD/JPY consolidates below tight resistance. The 14 relative strength index (RSI) is around 42, which is slightly negative, while the moving average convergence divergence indicator (MACD) has fallen slightly below the zero axis, and the negative histogram is mild. Therefore, if the subsequent trend breaks through the 50% retracement level of 159.61, it may encounter resistance near the 100 exponential moving average of 159.98 and 160.00 {market psychological mark}. A break above these levels should pave the way for further gains towards the 61.8% retracement of 160.65, as well as higher Fibonacci resistance at 162.12 and the 162.00 mark. On the downside, initial support is at the 38.2% retracement level of 158.58, with the integer mark close to 158.00 in front of it. If it falls further, it will expose the structural bottom near the 23.6% retracement level of 157.30.
Today you can consider shorting the US dollar at 159.53, stop loss: 159.70; target: 158.50; 158.60
EUR/USD
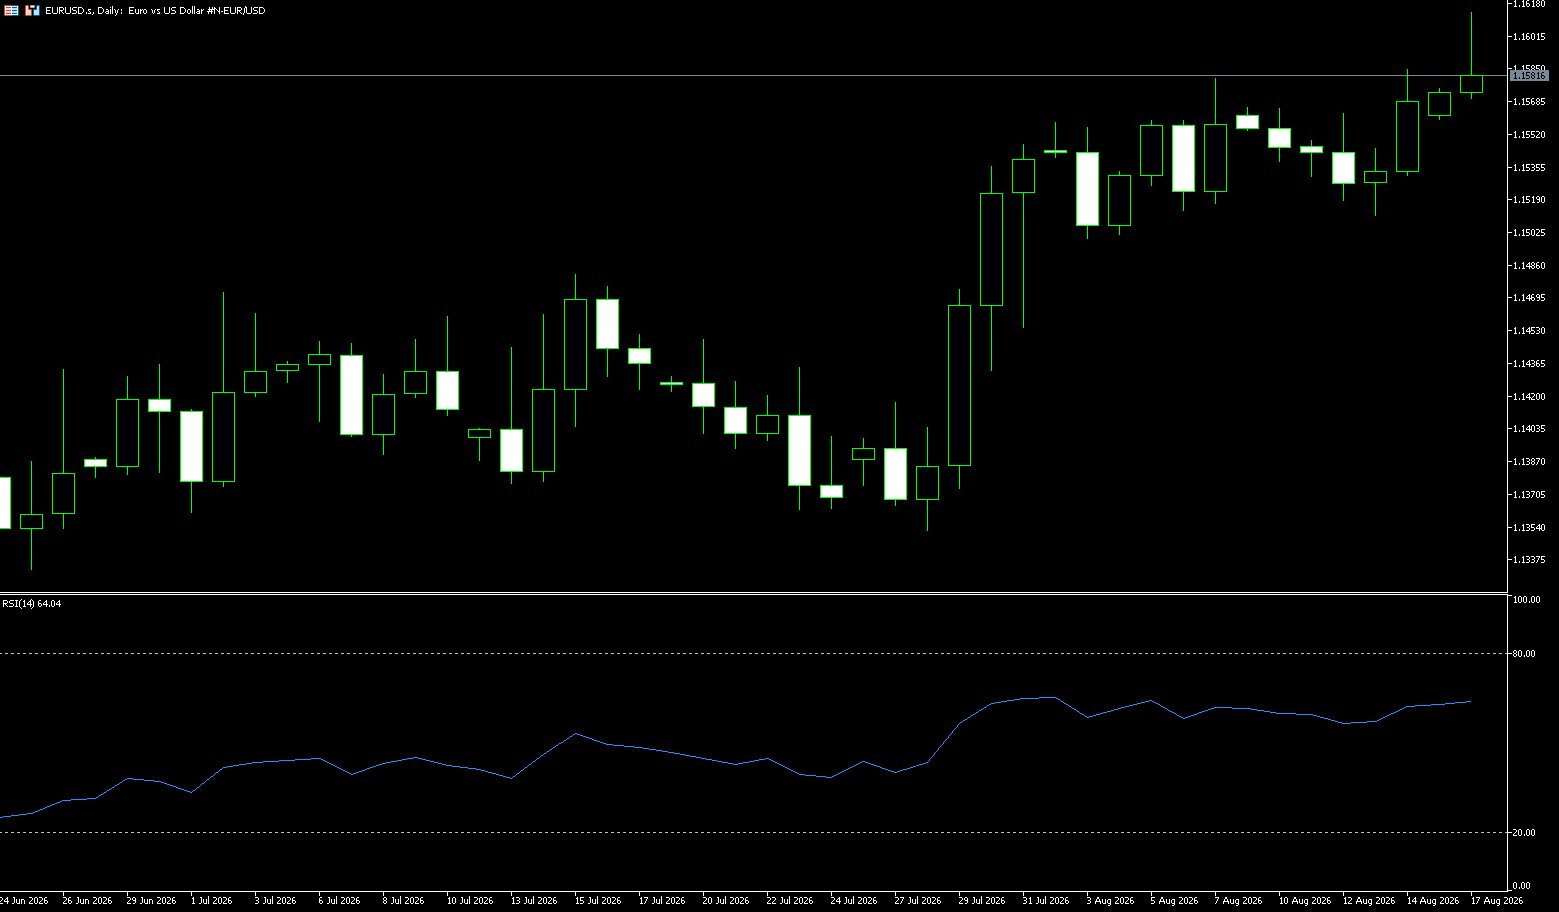
On Monday, the EURUSD continued its recent strong trend and is currently trading around 1.1575, testing the key psychological resistance level of 1.16. The recent weakening of U.S. economic data has prompted the market to re-evaluate the path of the Federal Reserve to raise interest rates. The pressure on the U.S. dollar has provided upside space for the euro. However, the euro is still in a wider range of shocks - although the technical picture has improved, there is no clear trend breakthrough yet. The gain or loss at the 1.16 mark will be a key signal to judge whether the euro has further upward potential. Policy differences within the Federal Reserve, geopolitical risks in the Middle East and uncertainty in energy supply have all added variables to the outlook for the euro. The core driver of the recent strength of the euro against the dollar is the subtle shift in the market's view of the dollar and the Federal Reserve. Recent economic data in the United States have been slightly weak, reinforcing the judgment that the Federal Reserve may not be able to raise interest rates as sharply as previously expected. If this idea continues, the US dollar will become the core driving force for the strength of the euro against the US dollar.
From a technical perspective, the euro has started to show some positive momentum. It is currently challenging the 1.16 mark - this large integer psychological level has stopped bulls many times over a long period of time. An effective breakout of this area would open up space towards 1.17 and suggest that the recent gains are gaining stronger market recognition. In terms of pullbacks, a short-term pullback may bring the 1.1500 area back into focus, which forms a technical resonance with the 50-day moving average of 1.1502 and is attractive to many technical traders. If there is further downside, the longer-term range structure will still be important - the pair may just have a technical rebound around 1.14. In the short term, the gains and losses of the 1.1600 mark and 1.1616 {June 17 high} are crucial: if there is an effective breakthrough, look at the 1.1700 mark level.
Today you can consider going long the euro at 1.1565, stop loss: 1.1555; target: 1.1600; 1.1610
Stock Analysis:
Australian ASX 200 Stock Index
Basic Market Overview:
The Australian Securities Exchange (ASX) 200 index fell 42 points, or 0.5%, to close at 9,073 on Monday, marking its fourth consecutive decline and a two-week low. Market sentiment remained cautious ahead of key July data from major trading partner China, including industrial production, retail sales, and the unemployment rate. Meanwhile, US Dow Jones futures weakened as no interim peace agreement was reached between Washington and Tehran, leaving few catalysts on the calendar except for the upcoming release of the Federal Reserve meeting minutes on Wednesday. Locally, July labor data is expected to be released later this week, following a stable unemployment rate in June. Meanwhile, Reserve Bank of Australia Assistant Governor Kent stated that tight monetary policy remains necessary to curb inflation.
National Australia Bank shares plunged 4.7% due to concerns that the removal of the property investment tax credit could impact earnings and credit growth. JB Hi-Fi's share price plummeted nearly 12% after reporting a decline in Australian sales in the first month of fiscal year 2027, marking its worst performance since March 2020. Other companies experiencing significant declines included Suncorp Group (-5.0%), QBE Insurance (-2.1%), and Pro Medicus (-2.0%).
Sector Performance:
Leading Sector: Materials +1.6%
Stronger commodities supported mining stocks, with BHP, Rio Tinto, and FMG rising; gold and lithium followed the commodity price rebound, becoming the only hedging force in the market. BHP will release its full-year earnings report on Tuesday, leading to pre-market speculation.
Leading Sector: Consumer Discretionary -2.5%
Disappointing retail earnings caused JB Hi-Fi to plunge over 11%, with Wesfarmers and Harvey Norman also weakening, reflecting market concerns about continued pressure on Australian consumer spending.
Financial Sector Weakens
NAB shares plunged nearly 5% after earnings release, with investors concerned about credit growth and adjustments to property tax policies suppressing bank profits; the four major banks were generally under pressure.
Technical Analysis:
The Australian Securities Exchange (ASX) 200 index closed at 9073.20, down 42 points, or 0.46%, marking its fourth consecutive day of decline and hitting a two-week low. The index traded with a weak bias throughout the day, briefly rebounding to around 9112 in the morning before encountering resistance. Selling pressure continued in the afternoon, pushing the index down to a low of 9065 before recovering slightly at the close. The index has retreated approximately 1.73% over the past five trading days, entering a phase of correction from previous highs. Tuesday's technical chart analysis—Daily chart: Four consecutive bearish candles have formed a short-term downward channel; the RSI has fallen but has not yet entered oversold territory; the bullish trend is entering a correction phase; holding above 9000 indicates high-level consolidation; a decisive break below 9000 would open up further downside potential towards 8950 or even 8900. Hourly Chart: The chart shows a continued downward trend, indicating a weak structure. To reverse this weakness, a break above 9110 with significant volume is necessary. Key Market Theme: The index's direction largely depends on the resilience of resource stocks, which could offset selling pressure from the banking and consumer sectors.
Tuesday's Technical Outlook: Two Scenario Predictions
1. Strong Scenario (Low Probability): Overnight, commodities remained strong, with SPI futures opening higher. A break above 9060 in the morning session could lead to a rebound towards 9110. A successful break above 9110 would further challenge 9150.
2. Weak Scenario (Base Scenario): A weak rebound would find resistance below 9110, testing the 9020-9000 support level. A break below 9000 with significant volume would accelerate the decline.
Trading Strategy:
Buy on Dips (Only betting on support levels to stabilize, conservative approach preferred)
• Buy on Dips Observation Zone: Stabilize within the 9000-9020 range and show a bottoming candlestick pattern.
• Target 1: 9060; Target 2: 9110
• Hard Stop-Loss: Exit if the price breaks below 8980.
It is not recommended to chase the price higher above 9060, as the current downtrend makes chasing the price risk-reward ratio very poor.
Bearish Strategy (Trend-Following Approach)
• Short Sell Observation Zone: Rebound to 9100-9110 followed by a pullback.
• Target 1: 9060; Target 2: 9000
• Hard Stop-Loss: Exit if the price rises above 9130.
Key Risk Warning:
Earnings Risk
BHP's full-year results will be released on Tuesday. Fluctuations in mining stocks will directly impact the index; disappointing earnings will quickly drag down the resource sector.
External Disturbances Risks
Overnight fluctuations in US stocks, the US dollar, iron ore, and gold prices; repeated impacts on cyclical stock valuations due to evolving Chinese demand expectations.
Domestic Macroeconomic Risks
Australia's July labor force data is due this week; strong employment data could further delay expectations of an RBA rate cut, suppressing stock market valuations.
Technical Breakdown Risks
9000 is a key level; if the closing price falls below 9000, the medium-term correction could widen, so avoid blindly buying the dip.
Japan Stock Market Index (JP225)
Basic Market Overview:
The Nikkei 225 index rose 0.74% on Monday, closing at 69,220 points, extending last week's gains, as preliminary data showed weaker-than-expected growth in the Japanese economy in the second quarter, with weak domestic demand offsetting strong exports. However, strong demand related to artificial intelligence continues to support the prospects of Japanese companies deeply integrated into the global semiconductor supply chain. Despite Japanese government bond yields surging to a 30-year high and markets betting on an imminent Bank of Japan rate hike, local stocks still rose.
Stocks related to chips and artificial intelligence mostly rose, including Kioxia Holdings (15.1%), Advantest (2.5%), Fujikura (7.3%), Tokyo Electron (1.6%), and Furukawa Electric (5.9%). Meanwhile, financial and consumer stocks mostly declined. In corporate news, Nvidia reportedly plans to invest up to $3 billion in SB Energy, a subsidiary of SoftBank Group, which is developing a large data center project for OpenAI in Ohio.
Sector Performance:
Leading Sectors
Leading Themes (AI / Storage Semiconductors)
Kioxia (+15.07%), Advantest, Tokyo Electron, and SoftBank Group led the gains; fiber optics and non-ferrous metals mining also strengthened, with foreign capital continuing to flow into the technology hardware sector.
Leading Sectors
Cybersecurity, advertising and media, and some consumer-weighted stocks were under pressure; Trend Micro, Dentsu, and NEC weakened significantly, dragging down the index's upside potential.
Technical Analysis:
The Nikkei 225 closed up 0.74% on Monday at 69220.25 points, trading within the range of 68688–69100, reaching a one-month high. Japan's Q2 GDP annualized growth rate was only 1.1%, significantly lower than the expected 2.0%, indicating weak domestic demand. Market interpretation: The weak economy will constrain the Bank of Japan's aggressive interest rate hike pace, while the relatively favorable liquidity environment offsets the negative economic impact. The USD/JPY pair maintained a slight fluctuation around 159, without rapid strengthening/weakening, and export companies' profit expectations remained stable. Tuesday's technical indicators—Daily chart: The price has stabilized above the 50-day moving average, with the center of gravity continuing to rise, indicating a medium-term bullish trend. The RSI has risen to the 60 range, not yet entering severe overbought territory, and still has upward potential, but it is very close to the overbought zone, so caution is advised against a pullback after a surge. 4-hour chart: An upward channel with higher highs and lower lows has formed; 69300 constitutes strong short-term resistance, having been tested multiple times without success. If it cannot break through effectively, it is likely to enter a period of range-bound consolidation. Pattern indication: Short-term, it is in a consolidation phase within an upward trend. Two scenarios: Optimistic: A firm hold above 69300 leads to continued upward movement; Cautious: Resistance at 69300 results in a pullback, potentially testing support at 68800 for consolidation.
Trading Strategy:
Tuesday's Bullish Strategy (Main Scenario)
• Entry Condition: Buy on a pullback and stabilization within the 68800-68900 range.
• First Target: 69300; break above to 69600.
• Stop Loss: Exit below 68480 (effective breach of strong support indicates a weakening trend).
Sell on Dips (Defensive Alternative)
• Entry Condition: Early morning rally to 69250-69400, followed by continuous resistance and inability to break through.
• Target: 68900 → 68800
• Stop Loss: Exit above 69650.
Key Risk Warning:
Japanese Yen Exchange Rate Risk (Biggest Variable)
If the USD/JPY exchange rate falls rapidly (yen strengthens), it will directly suppress export-heavy companies such as Toyota and Sony, potentially triggering a rapid index correction; closely monitor the USD/JPY 158 and 160 levels.
Risks Related to US Stocks
Japanese stocks have a high foreign investment ratio. Overnight fluctuations in the Nasdaq and S&P 500 will directly affect the Nikkei opening on Tuesday morning. Corrections in US tech stocks will spread to the Japanese semiconductor sector.
Technical Profit-Taking Risk
The index has rebounded to a relatively high level. AI and semiconductor stocks have seen significant short-term gains. Once funds rotate out, a concentrated correction in these sectors will drag down the index.
Macroeconomic Policy Expectations
Weak GDP data is only a short-term positive. The market will continue to speculate on the Bank of Japan's September interest rate decision. Any hawkish stance will trigger significant market volatility.
Disclaimer: The information contained herein (1) is proprietary to BCR and/or its content providers; (2) may not be copied or distributed; (3) is not warranted to be accurate, complete or timely; and, (4) does not constitute advice or a recommendation by BCR or its content providers in respect of the investment in financial instruments. Neither BCR or its content providers are responsible for any damages or losses arising from any use of this information. Past performance is no guarantee of future results.
More Coverage






Risk Disclosure:Derivatives are traded over-the-counter on margin, which means they carry a high level of risk and there is a possibility you could lose all of your investment. These products are not suitable for all investors. Please ensure you fully understand the risks and carefully consider your financial situation and trading experience before trading. Seek independent financial advice if necessary before opening an account with BCR.
BCR Co Pty Ltd (Company No. 1975046) is a company incorporated under the laws of the British Virgin Islands, with its registered office at Trident Chambers, Wickham’s Cay 1, Road Town, Tortola, British Virgin Islands, and is licensed and regulated by the British Virgin Islands Financial Services Commission under License No. SIBA/L/19/1122.
Open Bridge Limited (Company No. 16701394) is a company incorporated under the Companies Act 2006 and registered in England and Wales, with its registered address at Kemp House, 160 City Road, London, England, EC1V 2NX. Open Bridge Limited acts solely as a payment processor for BCR Co Pty Ltd and does not provide any financial, trading, or investment services on its behalf. Open Bridge Limited's role is limited to payment processing.


 English
 简体中文
简体中文
 繁體中文
繁體中文
 Bahasa
Melayu
Bahasa
Melayu
 Tiếng
Việt
Tiếng
Việt
 ไทย
ไทย
 日本語
日本語
 한국어
한국어
 ភាសាខ្មែរ
 español